15 common data science techniques to know and use
Data scientists use a variety of statistical and analytical techniques to analyze data sets. Here are 15 popular classification, regression and clustering methods.

Data science has taken hold at many enterprises, and data scientist is quickly becoming one of the most sought-after roles for data-centric organizations. Data science applications utilize technologies such as machine learning and the power of big data to develop deep insights and new capabilities, from predictive analytics to image and object recognition, conversational AI systems and beyond.
Indeed, organizations that aren't adequately investing in data science likely will soon be left in the dust by competitors that are gaining significant competitive advantages by doing so.
What exactly are data scientists doing that provides such transformative business benefits? The field of data science is a collection of a few key components: statistical and mathematical approaches for accurately extracting quantifiable data; technical and algorithmic approaches that facilitate working with large data sets, using advanced analytics techniques and methodologies that tackle data analysis from a scientific perspective; and engineering tools and methods that can help wrangle large amounts of data into the formats needed to derive high-quality insights.
In this article, we'll dive deeper into common statistical and analytical techniques that data scientists use. Some of these data science techniques are rooted in centuries of mathematics and statistics work, while others are relatively new ones that take advantage of the latest research in machine learning, deep learning and other forms of advanced analytics.
How data science finds relationships between data
When trying to identify information needles in data haystacks, data scientists, first, need to discern how different data elements correlate with or relate to each other. For example, if you have a bunch of data points plotted on a graph, how do you know if there's any meaning in them?
Perhaps the data represents a relationship between two or more variables and the job is to plot some sort of line or multidimensional plane that best describes the relationship. Or perhaps it represents clustered groups that have some affinity. Other data could represent different categories. By finding these relationships, we give meaning to the otherwise randomness of the data, which can then be analyzed and visualized to provide information that organizations can use to make decisions or plan strategies.
Now, let's look closer at the various data science techniques and methods that are available to perform the analysis.
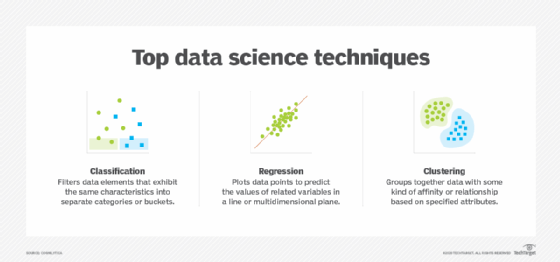
Classification techniques
The primary question data scientists are looking to answer in classification problems is, "What category does this data belong to?" There are many reasons for classifying data into categories. Perhaps the data is an image of handwriting and you want to know what letter or number the image represents. Or perhaps the data represents loan applications and you want to know if it should be in the "approved" or "declined" category. Other classifications could be focused on determining patient treatments or whether an email message is spam.
The algorithms and methods that data scientists use to filter data into categories include the following, among others:
- Decision trees. These are a branching logic structure that uses machine-generated trees of parameters and values to classify data into defined categories.
- Naïve Bayes classifiers. Using the power of probability, Bayes classifiers can help put data into simple categories.
- Support vector machines. SVMs aim to draw a line or plane with a wide margin to separate data into different categories.
- K-nearest neighbor. This technique uses a simple "lazy decision" method to identify what category a data point should belong to based on the categories of its nearest neighbors in a data set.
- Logistic regression. A classification technique despite its name, it uses the idea of fitting data to a line to distinguish between different categories on each side. The line is shaped such that data is shifted to one category or another rather than allowing more fluid correlations.
- Neural networks. This approach uses trained artificial neural networks, especially deep learning ones with multiple hidden layers. Neural nets have shown profound capabilities for classification with extremely large sets of training data.
Regression techniques
What if instead of trying to find out which category the data falls into, you'd like to know the relationship between different data points? The main idea of regression is to answer the question, "What is the predicted value for this data?" A simple concept that comes from the statistical idea of "regression to the mean," it can either be a straightforward regression between one independent and one dependent variable or a multidimensional one that tries to find the relationship between multiple variables.
Some classification techniques, such as decision trees, SVMs and neural networks, can also be used to do regressions. In addition, the regression techniques available to data scientists include the following:
- Linear regression. One of the most widely used data science methods, this approach tries to find the line that best fits the data being analyzed based on the correlation between two variables.
- Lasso regression. Lasso, short for "least absolute shrinkage and selection operator," is a technique that improves upon the prediction accuracy of linear regression models by using a subset of data in a final model.
- Multivariate regression. This involves different ways to find lines or planes that fit multiple dimensions of data potentially containing many variables.
Clustering and association analysis techniques
Another set of data science techniques focuses on answering the question, "How does this data form into groups, and which groups do different data points belong to?" Data scientists can discover clusters of related data points that share various characteristics in common, which can yield useful information in analytics applications.
The methods available for clustering uses include the following:
- K-means clustering. A k-means algorithm determines a certain number of clusters in a data set and finds the "centroids" that identify where different clusters are located, with data points assigned to the closest one.
- Mean-shift clustering. Another centroid-based clustering technique, it can be used separately or to improve on k-means clustering by shifting the designated centroids.
- DBSCAN. Short for "Density-Based Spatial Clustering of Applications with Noise," DBSCAN is another technique for discovering clusters that uses a more advanced method of identifying cluster densities.
- Gaussian mixture models. GMMs help find clusters by using a Gaussian distribution to group data together rather than treating the data as singular points.
- Hierarchical clustering. Similar to a decision tree, this technique uses a hierarchical, branching approach to find clusters.
Association analysis is a related, but separate, technique. The main idea behind it is to find association rules that describe the commonality between different data points. Similar to clustering, we're looking to find groups that data belongs to. However, in this case, we're trying to determine when data points will occur together, rather than just identify clusters of them. In clustering, the goal is to segregate a large data set into identifiable groups, whereas with association analysis, we're measuring the degree of association between data points.
Data science application examples
The above methods and techniques in the data science tool belt need to be applied appropriately to specific analytics problems or questions and the data that's available to address them. Good data scientists must be able to understand the nature of the problem at hand -- is it clustering, classification or regression? -- and the best algorithmic approach that can yield the desired answers given the characteristics of the data. This is why data science is, in fact, a scientific process, rather than one that has hard and fast rules and allows you to just program your way to a solution.
Using these techniques, data scientists can tackle a wide range of applications, many of which are commonly seen across different types of industries and organizations. Here are a few examples.
Anomaly detection. If you can find the pattern for expected or "normal" data, then you can also find those data points that don't fit the pattern. Companies in industries as diverse as financial services, healthcare, retail and manufacturing regularly employ a variety of data science methods to identify anomalies in their data for uses such as fraud detection, customer analytics, cybersecurity and IT systems monitoring. Anomaly detection can also be used to eliminate outlier values from data sets for better analytics accuracy.
Binary and multiclass classification. One primary application of classification techniques is to determine if something is or is not in a particular category. This is known as binary classification, because we could ask something like, "Is there a cat in the picture, or not?" A practical business application is to identify contracts or invoices among piles of documents using image recognition. In multiclass classification, we have many different categories in a data set and we're trying to find the best fit for data points. For example, the U.S. Bureau of Labor Statistics does automated classification of workplace injuries.
Personalization. Organizations looking to personalize interactions with people or recommend products and services to customers first need to group them into data buckets with shared characteristics. Effective data science work enables websites, marketing offers and more to be tailored to the specific needs and preferences of individuals, using technologies such as recommendation engines and hyper-personalization systems that are driven by matching the data in detailed profiles of people.
That's just a sample of useful data science applications. By understanding the various techniques, methods, tools and analytical approaches, data scientists can help the organizations that employ them achieve the strategic and competitive benefits that many business rivals are already enjoying.