8 Business Intelligence Trends to Prepare for 2021
Much has changed since consultant Howard Dresner first coined the term business intelligence (BI) in 1989 to refer to data analysis tools and techniques used to support business decision-making processes. The tools and techniques are more plentiful and powerful, to be sure. But the overarching trend in BI has been its increasingly egalitarian and ubiquitous nature: More people can access and customize business data from more places and for more purposes.
Here are eight BI trends that have furthered that change.
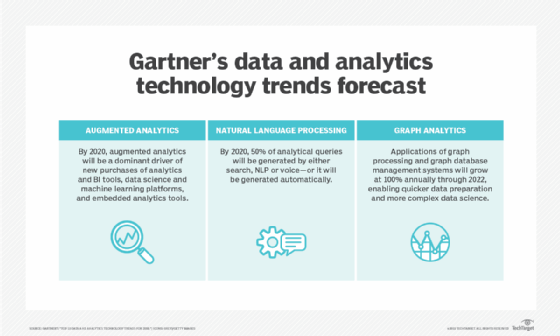
1. Augmented Analytics
Augmented analytics -- the use of machine learning (ML) and natural language processing (NLP) to enhance data analytics, data sharing and business intelligence -- has been cited by multiple researchers as one of the biggest business intelligence trends of 2020. These researchers include Gartner, which introduced the concept of augmented intelligence in 2017. The general idea behind augmented analytics is that they simplify the BI and analytics process for business users and citizen data scientists. Augmented analytics software tools work by doing much of the mundane heavy lifting involved in preparing data to be analyzed, such as parsing and scrubbing. Organizations can enter raw data source information into these platforms that will then scrub, parse and return business data for analysis. The use of machine learning and NLP gives augmented analytics tools the ability to understand and interact with data organically as well as notice valuable or unusual trends. In turn, businesspeople with no data science background can make queries and not rely solely on static bar graphs.
Augmented intelligence represents a third wave of business intelligence. The first wave came in the 1980s and 1990s and relied entirely on information technology experts. The second wave, self-service analytics, was still considered novel until recently.
In 2019, Gartner estimated that the augmented analytics market would reach $13 billion by 2023.
2. Embedded Analytics
Like augmented analytics, embedded analytics gives end users more power. If they see a data dashboard, they want to be able to work with the data -- zoom in, aggregate it, look at it from different angles -- with the press of a button. And enterprises want to put this power into the hands of their customers and employees to help them make better decisions. But creating interactive dashboards and advanced analytics functionality isn't as easy as generating a static table or chart and embedding that into a view or webpage.
Embedded BI reduces the workload on analytics teams, giving end users a faster way to obtain the insights they need while allowing analytics teams to focus on new products that help grow and differentiate the business. Analysts and engineers don't need to use custom software or concern themselves with scalability and security issues when delivering insights to end users, Ramesh Hariharan, co-founder and CTO at consultancy LatentView Analytics, has noted. Rather, dashboards and other visualizations can be integrated into applications without codes or libraries.
Allied Market Research projects the embedded analytics market to reach $60.28 billion by 2023, with a compound annual growth rate (CAGR) of 13.6% between 2017 and 2023.
3. Data Visualization
How compelling is your data story? Data quality and model accuracy matter, but you still need to explain what the data means. Specifically, you need to explain not only the what, but the why. Unlike a standalone data visualization, a data story has a beginning, a middle and an end, according to Charles Miglietti, CEO and co-founder of Toucan Toco, a data storytelling software company. The beginning should explain what your report or presentation is about and why it matters. The middle explains those ideas in greater detail, and the end summarizes the story and usually includes a recommendation.
Here are what experts say are the four most important features to successful data visualization and storytelling efforts:
- Context. All data storytelling requires context to illustrate the point you're trying to make and the audience you're addressing.
- Aesthetics and types of visualizations. Data visualization tools provide a lot of freedom. However, creative license can work against clarity when clarity should be your goal.
- Narratives. The data visualization narrative explains what the chart or graph means.
- Action. Explain what people should do with this information.
4. Data Quality Management
Managing data quality has become more complicated due to changes in how data is produced, processed and used. CompTIA, in its February 2020 Trends in Data Management report, noted that fewer companies are satisfied with data management now than in 2015. Specifically, 25% of companies feel like they are exactly where they want to be with their corporate data management, down from 31% in 2015. The report also noted that 38% of companies want to speed up their data analysis, while 37% said they need to integrate data throughout the organization.
Data quality management is key to the data management process. Data quality improvement efforts are often closely tied to data governance programs. Poorly managed data can lead to operational snafus, inaccurate analytics, lost sales opportunities and fines for improper financial or regulatory compliance reporting.
5. Predictive and Prescriptive Analytics Tools
Predictive analytics -- a form of advanced analytics that uses both new and historical data to forecast activity, behavior and trends -- has grown in prominence alongside the emergence of big data systems. As enterprises have amassed larger and broader pools of data in Hadoop clusters and other big data platforms, they have created increased data mining opportunities to gain predictive insights.
Predictive analytics involves applying statistical analysis techniques, analytical queries and automated machine learning algorithms to data sets to create predictive models that place a numerical value -- or score -- on the likelihood of a particular event happening. Prescriptive analytics seeks to determine the best solution or outcome among various choices, given the known parameters.
In 2019, the adoption of predictive analytics and AI stood out as features of the best data storage products of the year named by Storage magazine and SearchStorage.
In 2018, Zion Market Research estimated the global predictive analytics market was at approximately $3.49 billion in 2016 and expected it to reach $10.95 billion by 2022, growing at a CAGR of 21%.
6. Hyperautomation and Robotic Process Automation
Hyperautomation is the widespread application of technologies across an enterprise to automate decisions. Typically, it includes robotic process automation (RPA), identified by Gartner as one of software’s most rapidly growing categories.
Of these, RPA software stands out because it allows business experts and front-line workers with minimal or even no coding skills to automate low-level digital work tasks. Forrester predicts that by 2027, 29% of existing U.S. jobs will be lost to automation, while the automation economy, including through RPA, will create 13% new jobs, such as data scientists and automation managers.
By the end of 2020, Gartner predicts that more than 40% of data science tasks will be automated, resulting in increased productivity and broader use of data and analytics by citizen data scientists.
7. Artificial Intelligence and Business Intelligence
Business analysts, data scientists and engineers have been exploring the use of machine learning algorithms to augment their data analyses. Some use packaged BI and data preparation tools, while others offer more advanced tools, such as writing scripts to create customized predictive models using languages such as Python and R.
AI and BI have often been considered technologies with little overlap because BI is primarily retrospective in nature, while AI is all about the future. The statistical analysis behind BI is primarily about basic counts, in contrast with the ultra-sophisticated machine learning and deep learning algorithms that underpin AI.
A Computer Weekly/TechTarget IT Priorities survey confirmed that artificial intelligence and ML activities have gained significant ground as areas of intended enterprise software investment for IT buyers in the U.K. In the survey, 30% of respondents said they were planning to increase their spending on AI and machine learning technologies in 2020. As of this writing, it’s unclear how the COVID-19 pandemic will affect spending on these technologies.
The research also showed that 36% of respondents are using data science and data science platforms, 20% are using augmented analytics and streaming analytics, and 16% are using data catalogues -- all of which indicates sophisticated data science work.
8. Mobile BI
Mobile BI tools have held much promise, but their impracticality has held them back. The problem is that digestible data is largely visual and mobile screens, however, are tiny compared to computer screens. Recreating desktop dashboards doesn't work particularly well on a mobile device. Recreating the analytic capabilities of desktop device, therefore, doesn't work either.
Instead, the vendors who have developed successful BI for mobile apps have viewed phones and tablets as different entities than desktop computers, and they've created a different experience on their mobile apps.
Microsoft is taking a different tactic. In May 2020, it unveiled a significant new Power BI update. One new feature that adds AI capabilities is smart narratives, a natural language generation tool that allows report authors to add interactive narratives that Power BI generates automatically and gives end users explanations about their constantly updated data. Another new feature is a new mobile report authoring capability. Report authors can create mobile versions of their existing Power BI Desktop reports that users then view using Power BI mobile apps.
Mordor Intelligence, based in Hyderabad, India, valued the global mobile business intelligence market at $7.6 billion in 2019. It expects the market to register a CAGR of 22.43% during the forecast period 2020 to 2025, with the market reaching $25.5 billion by 2025.