Splunk .conf26: Context, control for Cisco's AI agents at scale
With its Splunk integration, Cisco shows how organizations can prepare enterprise platforms for AI agents by adding context for informed decisions and control over agent actions.

- Torsten Volk,
-
Omdia
Intelligence and advice powered by decades of global expertise and comprehensive coverage of the tech markets.
Recent research from Omdia, a division of Informa TechTarget, identified AI as the top driver of new infrastructure investments across public cloud, on-premises and edge environments. Yet enterprises are trying to generate returns from AI on platforms never designed for agents they must observe, explain and control.
At Splunk .conf26, Cisco showed how it is integrating Splunk across its portfolio to address this gap -- giving agents the operational context to make informed decisions and enterprises the controls to determine what those agents can and cannot do.
Context and control for trusted agents
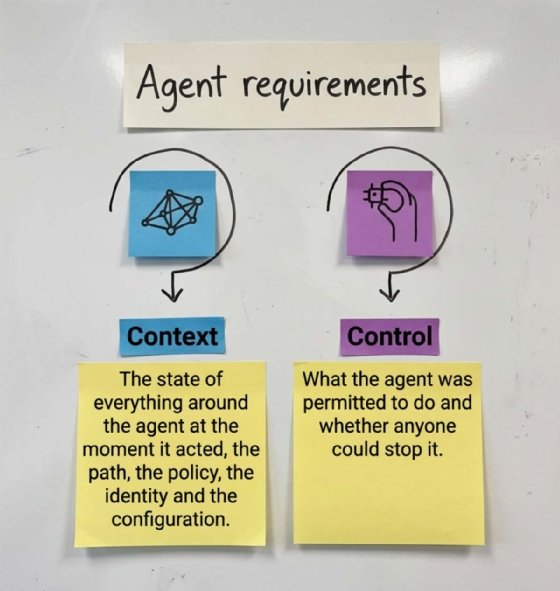
All announcements at Splunk .conf26 were focused on delivering a comprehensive platform that enables enterprises to provide their AI agents with the context and control needed for optimal decision-making and task execution within clearly defined boundaries.
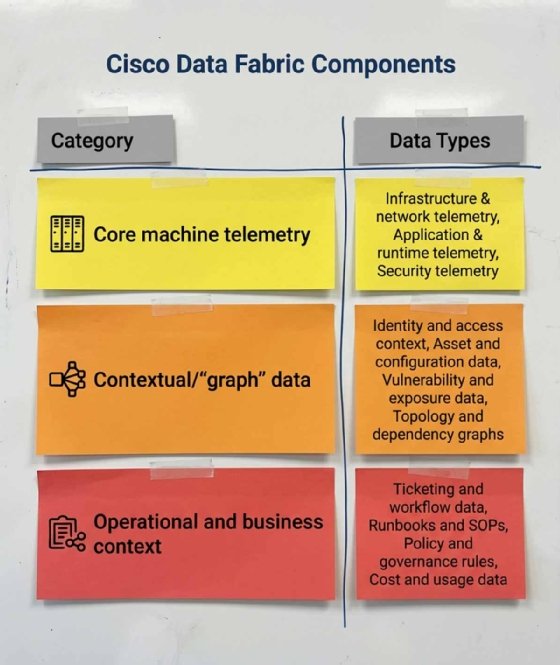
For example, an AI site reliability engineer (SRE) agent needs core telemetry data, such as metrics, logs, traces and events; contextual data, such as code releases, application dependencies, configuration data and identity information; and data on the operational and business context, such as ticketing, runbooks, standard operating procedures, cost and usage to autonomously determine the root cause of an issue, find a solution, propose this solution to a human for approval, execute the repair tasks and verify success.
The data layer: Giving AI agents context without cost-risk tradeoff
Splunk created the new Machine Data Lake (generally available in July) to address a tradeoff its own pricing model created: Customers had to decide upfront which data was worth indexing, leaving investigations oblivious to whatever they discarded.
The problem is that a log line's value depends on the question asked later. A connection-pool debug message can look like noise for 11 months until a checkout service starts timing out; those discarded messages would have shown that the pool was exhausted before each failure. Across thousands of services whose dependencies change with every deployment, teams cannot reliably anticipate which details they will need.
Data layer announcements
- Machine Data Lake: GA Aug. 4, 2026.
- Federated Search: Latest release GA July 6, 2026; AWS CloudWatch and Databricks available Sep. 15, 2026.
- Network Intelligence App: Sept. 15, 2026.
- Observability Cloud Essentials and Premier: Sept. 15, 2026.
- Cisco Cloud Control: Sept. 15, 2026.
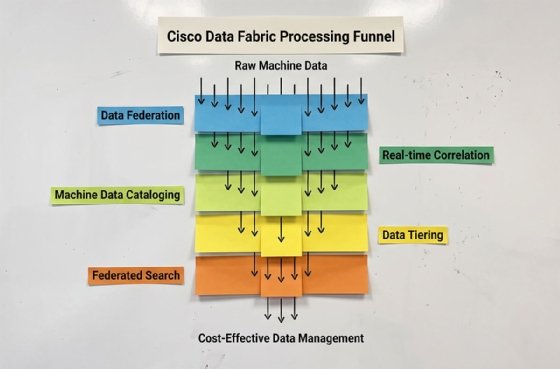
Splunk Machine Data Lake lets full-fidelity logs and events land in a low-cost, Splunk-managed storage tier, cataloged and schematized but not indexed. Humans or agents can then promote a relevant slice into an index or analytics table when needed. An SRE investigating a failed checkout could promote the relevant hour of load balancer and container runtime logs, then use Federated Search to correlate them with application logs already indexed and data held in Amazon CloudWatch or Databricks.
This shifts the cost decision from what should be retained to what needs to be activated for analysis. For AI agents, the potential benefit is access to evidence that an ingest-time filter might otherwise have removed.
Understanding Splunk's competitive advantage
Splunk does not have exclusive access to any of this data. Competitors such as Datadog, Dynatrace and New Relic can collect it via Simple Network Management Protocol (SNMP), NetFlow, IPFIX, sFlow, syslog and vendor APIs from Cisco and Meraki devices. Elastic ships integrations for Cisco IOS, Nexus, Meraki, ASA and NetFlow, and ThousandEyes streams its test results over OpenTelemetry to Datadog, Dynatrace or any compatible back end. The difference is in effort and resolution.
A network team no longer has to decide which syslog severities from thousands of switches and routers are worth ingesting. Cisco devices, ThousandEyes and the Cisco security portfolio feed their telemetry into the Splunk platform natively, including topology, device health events, interface counters and synthetic test results.
Take the checkout API that stalls for two seconds a few times an hour because of a microburst on one leaf switch port:
- On competing platforms, someone first has to have configured SNMP profiles for that switch, and the standard one-to-five-minute polling interval will then show a smooth average across a burst that lasted milliseconds. So, the team either sets up Telegraf or a custom collector for Cisco's streaming telemetry to get per-second queue drop counters or never sees them.
- On Splunk, the same counters arrive from the switch natively, at streaming cadence, already tied to the device's topology and health events in the also-new network intelligence app, so the correlation with the application trace is a search rather than an integration project.
The advantage is real but bounded. It applies to Cisco equipment, shrinks with every Juniper, Arista, Palo Alto or Fortinet device in the same environment and disappears for a cloud-native shop whose telemetry is OpenTelemetry from its own services. The fabric cannot show a state that no device or agent reports, and third-party gear still depends on whatever it logs.
The agent layer: Controlling what an agent does and what it costs
Alongside the lake, new Essentials and Premier editions of Observability Cloud -- together with the free edition launched in June -- lower the entry price rather than the bill. The lake and the native Cisco feeds cover the core telemetry and much of the contextual data an agent needs. The remaining announcements address how enterprises monitor, govern and build agents.
Splunk Agent Observability monitors the AI stack itself, including GPUs, vector databases, memory and orchestration frameworks. It also evaluates agent actions using Luna, a family of small evaluation models acquired with Galileo. According to Splunk, Luna grades all agent traffic, rather than a sample, fast and cheaply enough to support guardrails that block unsafe actions before a tool call executes.
Tokenomics adds cost and usage attribution. Cisco describes customers already routing inference from frontier models to open models on branch and desk-side servers. Rerouting a workflow to a cheaper model can change its output, which is why cost management and evaluation belong together. Tokenomics without per-action evaluations is a cheaper way to be wrong. Observability Studio addresses visibility during development, instrumenting applications with OpenTelemetry so the traces and dependencies an agent needs are available before the first incident.
Agent Observability and the network intelligence app also surface in Cisco Cloud Control, giving Cisco customers Splunk-powered insights without requiring a Splunk license. This is the quiet distribution play underneath the event: Cisco can bring Splunk capabilities to customers through the management platform they already use.
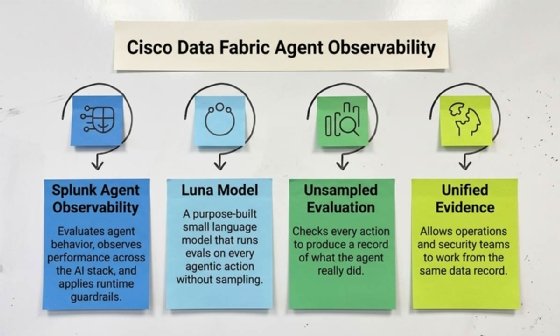
The Splunk Agentic SOC Workforce adds the security perspective -- which identity performed an action, what resources it affected and whether that behavior represents a threat. Its agents support detection engineering, threat hunting, investigation and response, and governance, while expanded exposure analytics add asset history and business risk context. Cisco's example is an agent that deletes 10,000 files. Agent observability helps reconstruct the workflow and tool calls behind the deletion; the security operations center examines the identity, permissions and security implications.
Bringing these perspectives onto one timeline helps teams distinguish an authorized operation from a faulty workflow or an attack. Enterprise Security now comes in Essentials and Premier editions, supporting different levels of automation and autonomous defense. Splunk also announced a multiyear agreement with AWS to codevelop security capabilities for AI-driven attacks, with details to follow.
The last slot is where customers build their own agents on all of this. The Splunk AI Assistant now runs agentic investigations on-premises; Agent Launchpad with templates, Model Context Protocol tools and a choice of models arrives later this year; and the Cisco AI Pod for Splunk runs the stack in private cloud and air-gapped environments on Cisco infrastructure with Nvidia acceleration. Cisco is selling the hardware and the software for the same on-premises AI decision, which creates one single point of accountability for some buyers and a lock-in question for the rest.
Agent layer announcements
- Splunk Agent Observability with Tokenomics: available Sept. 15, 2026.
- Luna evaluation models: Galileo acquisition, May 28, 2026.
- Observability Studio: Sept. 15, 2026.
- Splunk Agentic SOC Workforce: Sept. 15, 2026.
- Splunk Enterprise Security Essentials and Premier: Sept. 15, 2026.
- Exposure Analytics: Sept. 15, 2026.
- Splunk AI Assistant: available Sept. 15, 2026.
- Agent Launchpad: later in 2026.
- Cisco AI Pod for Splunk: available Sept. 15, 2026.
- Cisco and Nvidia partnership: Sept. 14, 2026.
- Splunk and AWS agreement: Sept. 14, 2026.
Final thoughts
Cisco's direction is clear: Make Splunk the analytics foundation connecting its networking, security and AI infrastructure portfolios. The value for customers will depend on how much integration work this removes and whether the combined platform gives them enough visibility and control to trust agents with consequential tasks.
The practical test is whether a team can trace an agent's action back to the evidence it used, establish whether it was authorized, understand its cost and intervene when it goes wrong. If Cisco makes that routine across the environments customers already operate, it will have given enterprises a reason to expand both their use of agents and their investment in Splunk.
Torsten Volk is principal analyst at Omdia covering application modernization, cloud-native applications, DevOps, hybrid cloud and observability.
Omdia is a division of Informa TechTarget. Its analysts have business relationships with technology vendors.