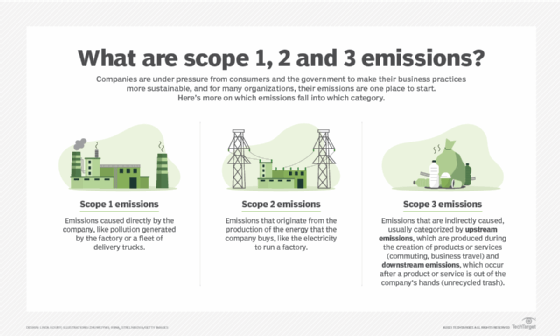
Scope 1, 2 and 3 emissions: Differences, with examples
With more companies tracking their carbon footprints, Scope 1, 2 and 3 emissions are under discussion. Discover what each is and the approaches to measure them.

Today's business executives are ramping up their environmental strategies to meet growing stakeholder demands. A foundational aspect of that effort is measuring organizational emissions.
Scope 1, Scope 2 and Scope 3 are categories that organizations can use to classify greenhouse gas (GHG) emissions they generate across their value chain. These standard categories define the sources of an organization's GHG emissions, which are gases that trap heat and thereby accelerate global warming and climate change. In addition, a fourth scope category helps organizations understand emissions they can avoid.
This guide provides a high-level overview of the following:
- Definitions and examples of Scope 1, Scope 2, Scope 3 and Scope 4.
- A snapshot of calculation methods.
- Challenges of calculating emissions.
- Common carbon accounting tools.
What are the different scopes, with examples?
The organization for global emissions standards, the Greenhouse Gas Protocol, established the scopes of emissions. These are meant to give organizations a framework to measure and report where and to what extent various organizational activities generate GHG emissions.
Making sense of GHGs
The language of climate change can be difficult to understand. Here's a cheat sheet of some of the important terms related to scopes of emissions.
Greenhouse gas emissions, or GHGs, are the climate-warming gases that trap heat in the Earth's atmosphere and act as a magnifier for the sun. Many scientists agree that human activities, especially burning fossil fuels, are responsible for global warming and climate change. Greenhouse gas emissions are the broadest emissions category. It includes carbon dioxide, methane, nitrous oxide and fluorinated gases.
Carbon dioxide, or CO2, is a colorless, odorless gas that forms most greenhouse gas emissions, which is why many people refer to GHGs as carbon pollution or carbon emissions.
CO2 equivalent is another term associated with emissions: It compares greenhouse gases based on their global warming potential.
Here's a breakdown of each scope.
Scope 1
A reporting company generates Scope 1 emissions using its assets. These assets are within the company's scope of control -- in other words, the things the company owns or directly controls, which is why Scope 1 is referred to as "direct emissions."
Examples of Scope 1 emissions sources include the following:
- Building furnaces.
- Onsite manufacturing equipment.
- Gas-powered vehicles, including forklifts, delivery vans and other company-related mobile equipment.
- Refrigerants used for commercial cooling equipment, refrigerators and air conditioning systems.
- Accidental leaks and spills, such as refrigerant leaks and chemical spills.
- Fugitive emissions, which are unintentional emissions from things such as industrial processes, refrigerators or gas transmission lines.
- Any controlled or owned asset fuel burning.
Because Scope 1 emissions are within a company's control, this is a natural starting point to set and accelerate sustainability goals.
Scope 2
Scope 2 includes emissions a reporting organization creates indirectly when purchasing electricity, steam, heat or cooling to run its operations. They are considered "indirect emissions" because although the reporting organization's activities generate GHG emissions, they occur at another source, such as at an energy company's site.
Examples of Scope 2 emissions sources include the following:
- Lighting in offices.
- Electricity to power machinery or vehicles.
- Natural gas heating for buildings.
- Power for data centers and computing servers.
Although indirect, Scope 2 emissions present both a major source of organizational emissions and a major opportunity for improved sustainability when companies reduce energy consumption or turn to low-carbon resources, such as solar energy, wind power or nuclear energy.
For example, CIOs and other IT leaders can improve operational efficiency and choose greener energy sources for enterprise technology systems, such as data centers, to reduce Scope 2 emissions.
Scope 3
Scope 3 encompasses all other emissions resulting from an organization's operations that aren't part of Scopes 1 and 2. As such, Scope 3 comprises emissions produced by entities up and down the organization's value chain, from the raw materials it sources to product disposal. This category of indirect emissions makes up most of an organization's carbon footprint.
Scope 3 can account for 75% of a company's emissions, according to MIT research.
This category is also more complex than Scope 1 and 2, as it has two subsets: Upstream Scope 3 emissions and downstream Scope 3 emissions.
Upstream Scope 3 emissions
Upstream emissions result from activities in the supply chain that support the production of the organization's products and services. Business travel and employee commuting also fall into this category.
This subset of Scope 3 GHG emissions comprises heat-trapping gases originating from everything needed to produce an organization's products and services.
Here are some examples:
- For a clothing manufacturer, upstream Scope 3 emissions include GHGs from the production of the fabric to make its clothes and GHGs produced while transporting raw materials from production facilities to the organization's factories.
- A restaurant chain's Scope 3 emissions include emissions generated in food growing, harvesting and transporting, as well as emissions produced in the production, transporting and cleaning of its table linens.
- A logistics company would count the emissions from manufacturing and servicing its vehicles.
The upstream Scope 3 emissions categories are as follows, according to the GHG Protocol:
- Purchased goods and services.
- Capital goods.
- Fuel and energy activities that are not part of Scope 1 or Scope 2.
- Upstream transport and distribution.
- Operationally generated waste.
- Travel for business.
- Employee commuting.
- Upstream leased assets.
Downstream Scope 3 emissions
Downstream emissions arise from the use and eventual disposal of the organization's products and services, as well as activities associated with operations.
Here are some examples, using the same types of companies highlighted in upstream Scope 3 emissions:
- A clothing manufacturer's downstream Scope 3 emissions include climate-warming gases produced in transporting finished products to retail stores and then ultimately to customers wearing and disposing of the clothes. They also include GHGs associated with the product's end-of-life recycling or landfill disposal.
- The restaurant chain's downstream emissions would similarly include those associated with composting or disposing of food waste.
- The logistics company would count the emissions from reselling, warehousing or disposing of its vehicles when no longer needed.
The downstream Scope 3 emissions categories are as follows, according to the GHG Protocol:
- Downstream transport and distribution.
- Solid product processing.
- Use of sold products.
- End-of-life treatment of sold products.
- Downstream leased assets.
- Franchises.
- Investments.
Scope 4 emissions
Scope 4 is a category the World Resources Institute devised in 2013 to account for what it terms avoided emissions. Many organizations now use this voluntary metric to gain a more detailed understanding of how their direct and indirect activities affect their overall carbon footprints.
Scope 4 comprises emission reductions that "occur outside a product's lifecycle or value chain but as a result of the use of that product," according to "Do We Need a Standard to Calculate 'Avoided Emissions'?" published November 5, 2013, by the World Resources Institute, which established the GHG Protocol.
Some refer to Scope 4 emissions as "climate-positive" or "net-positive" emissions.
According to the World Resources Institute, Scope 4 emissions include the following:
- Low-temperature detergents.
- Fuel-saving tires.
- Energy-efficient ball bearings.
- Teleconferencing services.
All these items or tools have sustainability-generating features. For example, low-energy detergents help avoid emissions from heating water for warm or hot washes. Additionally, employees working from home or attending a virtual conference instead of flying to a conference avoid emissions associated with car commuting and air travel, respectively.
How are the scopes calculated?
Calculating and reporting emissions is a complex, multistep process that requires organizations to identify all their emissions sources in each scope first. Organizations can then use formulas, frameworks and tools to collect and analyze the required data and to calculate and report the final figures.
Corporate, sustainability and IT leaders generally need a way to track their emissions over time to understand whether they meet their sustainability goals or need to step up sustainability activities to hit their desired or mandatory targets.
Similarly, leaders typically need a way to benchmark their emission figures against others in their industry or the overall marketplace to identify whether their sustainability record puts them ahead or behind others and, thus, whether their sustainability record is a differentiator or a liability to them.
Given the complexity of the task, organizational leaders use a combination of protocols, best practices, frameworks, assessment guidelines and software to calculate emissions.
The GHG Protocol provides widely used frameworks for calculating emissions.
Calculating Scope 1
Scope 1 calculations assess emission sources and then use one of two methods to determine emissions: direct measurement through monitoring concentration and flow rates, or fuel analysis based on the purchased quantities of commercial fuels and associated emission factors.
Calculating Scope 2
Organizations typically use metered consumption and supplier-provided emissions data to calculate Scope 2 emissions. The GHG Protocol requires organizations to use market-based and location-based reporting methods to calculate and disclose Scope 2 emissions.
Calculating Scope 3
The GHG Protocol publishes its standard and a guide for organizations to complete their Scope 3 inventories. Calculating Scope 3 emissions is the most complex category because it covers numerous sources.
Calculating Scope 4
Although not as wide-reaching as Scope 3 calculations, Scope 4 calculations are usually more complex than determining Scope 1 and Scope 2 emissions.
Scope 4 requires calculating an organizational baseline from which to determine avoided emissions, including lifecycle and market assessments and monitoring and calculation methodologies. Although not as widely used as other scopes, Scope 4 can help organizational leaders set sustainability goals and determine which suppliers to work with.
Challenges in calculating emissions
An increasing number of organizations are calculating and reporting their GHG emissions in keeping with various ESG reporting frameworks. Despite such frameworks and emerging legislation, many organizations struggle to calculate their emissions and understand their carbon footprints.
Some challenges include the following:
- Data quality, as well as the availability of and access to quality data.
- Issues with regulations and disclosure standards, which can vary and continue to evolve.
- Low or limited stakeholder engagement, as not all organizations are required or see the need to calculate and report on GHG emissions.
- Limited resources for sustainability activities and reporting, particularly if reporting is not required.
- Limited experience with and integration of emissions data capturing, tracking and reporting.
Tools for carbon accounting and emissions reporting
The dangerous level of climate-warming emissions, and the subsequent pressure to track and report on GHGs and increased scrutiny of the business sector's carbon footprint and overall environmental impact have boosted an interest in carbon accounting software.
Some key carbon accounting software providers include the following:
- IBM.
- Microsoft.
- Persefoni.
- Salesforce.
- SAP.
As the world grows hotter due to global warming, more business, sustainability and IT leaders are taking action. That action starts with understanding their organization's contribution to the problem so they can begin a sustainability journey.
Editor's note: This article has been updated to reflect changes in sustainability best practices and offer the most up-to-date information on regulations and frameworks.
Mary K. Pratt is an award-winning freelance journalist with a focus on covering enterprise IT and cybersecurity management.
Dig Deeper on Sustainable IT
-
![]()
Understand greenhouse gas emissions vs. carbon emissions
By: Diann Daniel
-
![]()
What you need to know before emissions regulators come knocking
By: Jay Dietrich
-
![]()
CO2 vs. CO2e: What is the difference and why does it matter?
By: Carolyn Heinze
-
![]()
Google slams claims it’s ‘misleading’ the public with its GHG emissions data
By: Caroline Donnelly