
kentoh - Fotolia
How Lean value stream mapping cuts delay, boosts efficiency
You have a backlog, work in short sprints, and track metrics on test coverage and defect rates -- so why does it still take so long to move code to production? Try visualizing it.

Programmers who focus in increments of two-week sprints can be left in the dark on long-term business strategy. Shine a light on processes and potential improvements with visual aids.
When organizations visualize processes, IT professionals can grasp where and when work happens, and how to improve upon it. A value stream map makes the processes of work visible. With that tool, organizations can identify opportunities for improvement and then measure that improvement.
Let's break down the components of Lean value stream mapping, and why the approach is popular in Lean development and beyond, including DevOps.
First, we'll look at what a Kanban board tells us versus the same processes broken down by a value stream map.
What goes into value stream maps
A value stream map conveys a lot of the same information as a Kanban board, but it more comprehensively illustrates a workflow.
Take a look at this simple Kanban board.
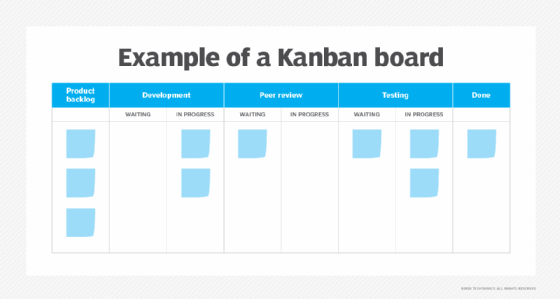
A team must make some calculations to translate a Kanban board into a value stream map. For each step outlined in the top row of the board, the team must determine average cycle time -- i.e., the amount of time it takes to do the work of that stage -- and the non-value-add waiting periods between steps.
When programmers complete a task in progress, they move the story to the waiting stage prior to the Peer review phase. With a Kanban board, the development team can track and create reports on the flow of work, including what adds value and what does not.
Here's the same information, presented as a value stream map:
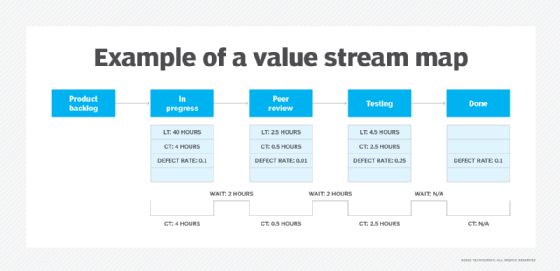
Here are the components of this value stream mapping example:
- LT is lead time. This is the amount of time between the start and conclusion of a stage.
- CT is cycle time. This measures how long it takes to do work at a stage, as explained above. It can also be called the process duration time.
- Defect rate. This is the ratio of work rejected at a particular stage and sent back for rework compared to the overall work.
- Wait. These gaps or buffer states between each phase represent delays with no value.
In addition to these components, the team can calculate process cycle efficiency (PCE), also called touch time, to gauge opportunities for improvement. PCE is the percentage of time a task is in progress, rather than in the waiting period. The lower the number for touch time, the longer the wait for work to get done. To calculate PCE, divide CT by LT. In this example, here are the touch times for the above stages:
- In progress: 10%
- Peer review: 20%
- In test: 56%
- Done does not have lead or cycle times to measure, as work is completed here.
Based on this calculation, the In progress stage presents the biggest opportunity for improvement. This manner of dissecting workflows is how a value stream map delivers more value than a Kanban board.
Notice the high defect rate within the Testing stage. A low defect rate could indicate a positive trend -- that the software is of higher quality earlier in the process -- or a negative one -- that testing isn't thorough enough. Track the defect rate at the Done stage to determine how effective your testers are in their work.
Optionally, the value stream map could include a Production stage after Done. With a Production stage, the team could calculate the cycle time and lead time at Done to gauge the amount of delay in deployment. Tracking this measurement might provide a good argument for a DevOps-friendly approach like continuous deployment, especially if bottlenecks occur late in the workflow.
Lean into value stream maps
Some IT organizations follow the Lean development methodology, which emphasizes a reduction in waste and increase in efficiency. Thus, Lean and value stream mapping have complementary objectives, and the latter is a common practice within the former.
Lean organizations should deemphasize velocity -- the amount of work that can be completed in given timeboxed effort, such as a two-week sprint -- and instead prioritize cycle time. The waiting stages are a way to visualize delays so that the team can identify and rectify their causes. Ideally, the team aims to limit work in progress. The goal is to achieve one-piece flow, a Lean tenet in which work moves between stages with zero wait time. Lean value stream mapping helps organizations visualize, then reduce, these waiting periods.
In many circumstances, forces outside of development and IT operations cause the lengthiest delays. For example, an application update might require approval from business stakeholders before it can move from design to development. Don't forget to look outside of IT for opportunities to visualize and address delays.
How to formulate value stream maps
When an IT organization devises its value stream map, it can identify points of delay in workflows. Address these opportunities for improvement before coding begins and you might see amazing results, but it isn't easy. Create and compare several Lean value stream map models. The first option might not be the best one.
Let's use an example in which a development team with 10 members creates a value stream map. The team could divide into five groups of two people. Each pair then devises a model. Later, the team reconvenes to compare all the mockups. What everyone sees represents the different assumptions made by each team member about cycle, lead and wait times. These disagreements can actually be helpful, as they showcase the full team's knowledge to identify where problems might occur during the actual work.
Beyond the team level, people might not agree at all. Expect substantial delay as these groups learn to collaborate and calibrate. Here's a real scenario from a colleague: Three teams were responsible for the deployment of a single file to extend a system. To communicate changes, the teams needed coordinators, analysts, managers and trackers. At the 12-week mark, the teams would make a mass deploy with many changes. A single cross-discipline team member would make each change in about 90 minutes, and the rest was largely wasted time. The project's average wait time was six weeks.
Difficult as it might be, it's imperative that you identify these points of significant delay.
Value streams elsewhere
Value streams aren't just about delivering value to a customer. It's all about process efficiency; thus, it can also improve internal processes.
A company could use value stream maps to visualize, for example, its onramp program for new employees. Rather than the allotted three-month window to get an employee up to speed, the company might find that it only takes two weeks, or a month. This delay yields zero productivity from the new hire early on, which can be a source of frustration for the employee and the company.
Many employees lack an understanding of the processes upstream or downstream from the work they do. When employees do understand, via Lean value stream mapping or another means, they can empathize with the difficulties team members face at different phases of the value stream. Then, they can adjust their efforts accordingly to help work progress smoothly.