
Getty Images/iStockphoto
MELT away your cloud observability troubles with open source
In today's complex cloud environments, enterprises face a critical visibility challenge. Comprehensive observability isn't just a technical advantage -- it's a business imperative.

Today, companies process extraordinary amounts of data to gain operational insights and cloud awareness, but they're frequently overwhelmed. Legacy, single-purpose tools -- limited in scope and often challenging to use -- simply can't gain actionable cloud insights.
Observability has undergone generational changes as IT systems have steadily evolved in complexity. For example, in the early 2000s, the trend away from monolithic infrastructures toward microservices, cloud and advanced wireless networks required different approaches for managing and visualizing performance. At the time, these related offerings were primarily reactive, in contrast to today's proactive, granular offerings designed specifically to address complex, distributed environments.
As organizations look to meet new resource demands for their modern IT infrastructure, comprehensive observability offers a technical advantage that ensures reliability, high performance and innovation. Gain a greater understanding of how telemetry data can improve your systems and how open source tools provide the greatest flexibility.
4 pillars of comprehensive cloud observability
Cloud observability ensures that all deployment models remain high-functioning and consistent by gathering and assembling telemetry data for analysis. Data indicators delivered through observability explain why an event happened and help administrators uncover root causes of the issues. These data sources comprise metrics, events, logs and traces -- commonly referred to as MELT -- which administrators use to better understand system behavior, adopt automation and reinforce security.
These indicators are the following:
- Metrics. Aggregate and provide numerical data related to system performance, including CPU, memory and system requests. Administrators can observe changes over time and investigate anomalies, such as sudden spikes in memory or CPU usage.
- Events. Capture resource changes across cloud environments to indicate precisely where an aberration occurred.
- Logs. Show the specific sequence of actions that led to a change in state or to system errors.
- Traces. Capture the flow of requests across multiple systems and enable IT teams to pinpoint bottlenecks and optimize overall performance.
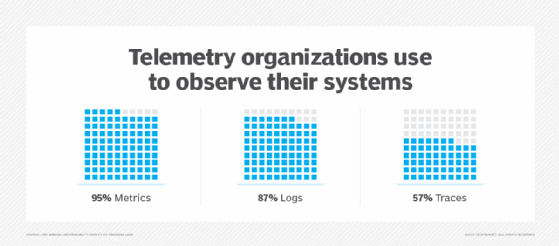
According to Grafana Labs' third annual "Observability Survey", organizations overwhelmingly rely on metrics (95%) and logs (87%) -- both of which are also used for legacy monitoring -- as well as traces (57%). By correlating these indicators, IT teams can improve service performance and accelerate troubleshooting to resolve problems, such as service slowdowns or security breaches.
In terms of MELT, key observability best practices include the following:
- Consider using structured logs, such as JSON and Grafana Loki, and centralized log storage for easier retrieval.
- Ensure that logs efficiently consolidate data -- using logging tools, such as Amazon CloudWatch Logs, Datadog and Dynatrace -- and capture relevant contextual information and integrate all telemetry from metrics and traces.
- To accelerate IT problem resolution, offer real-time capabilities for integrating UX data, along with business context, with the integrated platform of choice.
The critical role of observability in distributed systems
By employing cloud-native observability, IT teams can track behaviors of every service, application and connection. They can also quickly adjust service delivery before issues reach end users, as well as roll out new features and adopt new tools.
The trend toward distributed services, cloud and advanced wireless networks requires the versatility of open source offerings to reduce mean time to detect and mean time to restore. Low rates in both metrics indicate fast issue resolution and recovery times, enabling IT teams to allocate resources efficiently and fine-tune environments to meet demand and user requirements.
When performing root cause analysis, IT teams not only can isolate core performance problems, but can also resolve them faster. For example, a storage management issue might create database conflicts that cause service slowdowns. Administrators can correlate MELT data to uncover the source of the problem and prevent it from recurring.
Administrators and DevSecOps can also boost security by using cloud observability for faster anomaly detection, responding to cyberthreats accurately based on clear context. Finally, the ability to scale confidently as cloud requirements grow in complexity represents an essential requirement.
The case for open source observability tools
Traditional observability tools are generally inefficient for maintaining virtual and distributed services. For example, they struggle to handle unstructured data in incompatible formats, which results in siloed processes with limited automation capabilities and cumbersome management features. These deficiencies in collecting relevant data further complicate cloud service management by limiting oversight and forensic investigations.
Additionally, cloud service providers offer proprietary observability features, but they can create meaningless data noise, making it difficult to pinpoint where problems occurred. However, enterprises remain wary of vendor lock-in and are cautious about the complexity and costs of switching providers should their cloud preferences change. For example, high exit costs often result in expensive and resource-consuming efforts to migrate observability data, tools or infrastructure. That scenario is complicated further by vendor-specific data formats and proprietary APIs.
Administrators are opting for standalone, open source observability tools and integrated platforms. These dynamic alternatives not only meet IT skill-level and budget constraints, but they also offer comprehensive visibility for data analysis, proactive problem-solving and continuous cloud service improvement.
Popular open source observability options include the following:
- Datadog. An observability platform that offers full visibility into each layer of a distributed environment.
- Dynatrace. An integrated platform for monitoring infrastructure and applications, including networks, mobile apps and server-side services.
- Grafana. A centralized platform for exploring and visualizing metrics, logs and traces.
- OpenTelemetry. A framework that includes APIs, SDKs and tools for collecting telemetry data.
- Prometheus. A systems monitoring and alerting tool that collects and stores metrics.
Adoption considerations
Admins should consider a number of parameters to successfully adopt an open source tool or an integrated cloud observability platform. Proactive problem-solving and continuous improvement represent key benchmarks for achieving success with open source cloud observability.
When examining and adopting an open source observability tool, consider these steps:
- Define observability objectives.
- Identify the most crucial data sources for monitoring.
- Perform a cost-benefit analysis to ensure positive ROI.
- Ensure the tool integrates seamlessly with the current IT infrastructure and offers long-term viability.
- Gradually transition away from reliance on current proprietary tools.
Kerry Doyle writes about technology for a variety of publications and platforms. His current focus is on issues relevant to IT and enterprise leaders across a range of topics, from nanotech and cloud to distributed services and AI.