What is observability? The ultimate guide for IT teams
Observability in IT is the ability to understand what a system is doing internally -- what operational condition or functional state it is in -- by evaluating the relationships between its inputs and outputs. That is, if the system's inputs and outputs can be determined accurately, its behavior can be determined. This is often described as a top-down assessment.
Observability works by gathering data from various sources and processing it to infer the system's operational state. When the system's outputs respond to changing inputs within acceptable parameters -- such as latency or accuracy -- the system can be determined to be operating normally. If outputs deviate from expected responses or fall outside acceptable parameters -- such as inaccurate or no output -- the system can be said to be operating poorly or malfunctioning.
Observability is vital for modern business. At its most basic level, it's an essential part of complex IT system design, reliability and troubleshooting. Advanced technologies, such as AI, rely on observability to monitor the performance and accuracy of machine learning (ML) models and to meet compliance and business ethics requirements.
Differences between monitoring and observability
The concepts of monitoring and observability are related, but the relationship is complex. The following are some of the major differences:
- Monitoring tools passively gather information, most of which turns out to be insignificant. This can drown operations personnel and even AI tools in data. Observability actively gathers data to focus on what's relevant, such as performance metrics and factors that drive operational decisions and actions.
- Monitoring tends to gather information from available sources, such as management information bases, APIs and logs. Although observability will also use these sources, it will often add specific new points of information access -- such as traces -- to gather essential information.
- Monitoring focuses on infrastructure, where observability focuses equally on applications. That means observability often focuses on workflows, whereas monitoring focuses on point observations.
- The data made available through monitoring is often the sole expected outcome. Observability presumes that data sources contribute to an analytic process that optimally represents the state of an application or system. Stated differently, a monitoring data point is what it is, while an observability data point is likely to be analyzed further.
The pillars of observability
There are as many as five primary source data types referred to as the pillars of observability: logs, metrics, traces, events and profiles.
1. Logs
Rolling records of events, typically in textual or human-readable form, are known as logs. They are almost always generated by infrastructure elements, including both network devices and servers. They can also be generated by platform software, including OSes and middleware. Some applications will log what the developer believes represents critical information. Log information tends to be historic or retrospective and is often used to establish context in operations management. However, logs can also represent collections of events or telemetry data, and the detailed information can be available in real time.
2. Metrics
A metric is a parameter that is important to the operational performance of a device or software workload. It's different from a KPI, which typically relates to a business outcome. Metrics are typically accessed either through an API using a pull or polling strategy, or as a generated event or telemetry -- a push or notification, for example. Because they are event-driven, most fault management tasks are driven by metrics.
3. Traces
Traces are records of information pathways or workflows that follow a unit of work, such as a transaction, through the sequence of processes that application logic directs. Because work steering is normally a function of the logic of individual components or of steering tools, such as service buses or meshes, a trace is an indirect way to assess (observe) the logic of an application. Some trace data might be available from workflow processes, such as service buses or cloud-native microservices and service meshing. However, IT teams might need to incorporate tracing tools into the software development process to gain full visibility.
4. Events
An event is any occurrence or change in a system or workload that can be detected. Events are typically critical, such as a loss of system health or availability. But events can also be noncritical, such as an expected change in resource provisioning to accommodate workload scalability. Events are typically logged and appear in log data. However, watching and reacting to events in real time can enable faster troubleshooting and issue mitigation, helping preserve customer experience (CX), rather than waiting to analyze logs.
5. Profiles
A profile provides information that defines what is present. A profile is typically an assortment of data, settings, paths and other configuration elements needed to successfully define a user's environment, workload installation or behavior, a system configuration or other elements of the infrastructure. Profiles support personalization, access or management, so monitoring and understanding the profiles present in a complex environment is an increasingly important part of observability.
All pillars are vital to observability, but each has unique limitations that should be considered. For example, metrics can be hard to tag and sort and difficult to use for troubleshooting. Logs can be challenging to sort and aggregate to draw meaningful conclusions or relationships. Traces can produce enormous amounts of unnecessary data. Events demand high-priority responses, and profiles can offer little troubleshooting data. Thus, observability practitioners can still encounter limitations in gathering genuine insight, find far too many places to look for problems or have difficulty drilling down into the data to translate issues into actionable problems.
Practitioners might find it more effective to use the pillars of observability through a goals-oriented or business-centric lens: Set business objectives, such as service-level objectives, and then set observability goals that align with those objectives. For example, if the business is concerned with latency or throughput, set appropriate latency or throughput objectives, and then use the three pillars to approach observability with those business goals in mind.
Why observability is important
In simplest terms, observability is about understanding why something is happening, not just what is happening. This carries profound impacts on system design and business outcomes.
For decades, businesses that control and depend on complex distributed systems have struggled to address problems whose symptoms are often buried in floods of irrelevant data or that manifest at high levels as symptoms of underlying issues. The science of root cause analysis emerged from this problem, as did the current focus on observability. By focusing on the states of a system rather than the states of its elements, observability provides a clearer view of the system's functionality and its ability to fulfill its mission. A better perspective of system functionality also provides improved UX and CX.
Observability is proactive when necessary; it includes techniques, such as instrumentation, to add visibility where it might be lacking. In addition, it is reactive, prioritizing existing critical data.
Observability can also tie raw data back to more useful business measures, such as KPIs, which are effectively a summation of conditions to represent broad UX and satisfaction. For example, metrics can easily translate into a system's transaction rate, which can readily be turned into a KPI that provides meaningful business insight. Similarly, performance data gathered through observability can help identify issues, such as performance bottlenecks, resource inefficiencies and points of performance degradation, which can be understood and remediated to boost business results.
Observability in DevOps
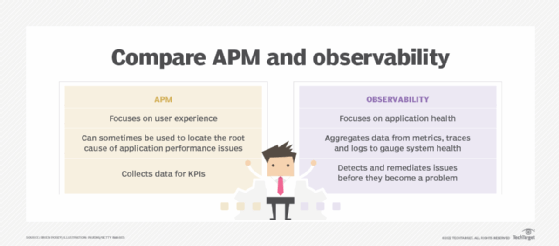
DevOps is a software design methodology that blends development techniques with IT operations. Observability is often associated with DevOps because it encompasses the tools and approaches used by DevOps teams to generate, collect and analyze data directly relevant to application performance -- such as a critical distributed application and its performance in real time.
DevOps observability goes beyond traditional application performance monitoring, which works well for traditional monolithic software applications. However, it can be inadequate for complex application architectures and dependencies in modern application designs, such as microservices.
By applying observability throughout workload design, deployment and monitoring, DevOps engineers can monitor the workload's dynamic behavior under varied conditions. These analyses can then be used to objectively justify fixes, updates and redesigns that will improve the workload's performance and reliability -- further enhancing the CX.
Observability in AI
The emergence and explosive growth of AI have brought an urgent new emphasis to the role of observability in AI. ML models and AI platforms are now being used for autonomous vehicles, advanced robotics, medical diagnostics and a host of other tasks that can have direct impacts on people's economic and physical health. Observability is needed to ensure that AI systems are monitored end to end and that their performance, accuracy and decision-making outcomes are well understood.
Observability in AI ensures that AI systems make decisions fairly, work reliably and efficiently and maintain appropriate security and compliance. Observability can detect common AI issues, such as bias, hallucinations, unpredictability and accuracy drift, in real time. This can be particularly critical as AI systems gain more self-learning capabilities and ever greater autonomy. Observability is a key element of comprehensive AI governance and compliance for AI platforms operating in production environments.
Practical examples of observability
There are countless examples of observability in technology and business. Here are some common use cases:
- Anomaly detection. Anomalies or exceptions, such as unusually high workload traffic, slow response times or high latency, suspicious network activity and degradations in data quality or AI accuracy, can all serve as early warnings for system troubleshooting. For example, an observability tool for an e-commerce site might detect slow performance in a checkout page and correlate the slowdown to a specific database in a microservices workload -- then reroute traffic or correct the database issue in real time.
- Performance optimization. Organizations can use observability to identify reductions in workload efficiency or find resource-intensive processes. This can trigger optimizations such as scaling resources to maintain workload performance and preserve CX. This can include IT-focused systems, such as servers, or physical systems, such as production manufacturing equipment instrumented with IoT sensors.
- Predictive maintenance. Observability can be coupled with analytics and AI to predict impending failures and trigger remediations before downtime occurs. This works for IT-centric workloads, detecting potential problems in infrastructure or applications. It also supports physical systems, such as detecting maintenance demands for logistics companies' delivery vehicles and scheduling maintenance before an engine failure occurs.
- Data quality and AI accuracy. AI system outputs can "drift" as data content and quality change. Observing AI outputs can detect degraded performance and trigger tuning or retraining, or focus attention on data gathering and data quality -- such as a failed data source or IoT sensors no longer delivering important data.
- Capacity planning. Observability can help correlate provisioned resources to workload performance for a given volume of users or transactions. By using observability to track changing performance trends, DevOps engineers can use historical data to forecast future resource needs and scale resources to maintain workload performance.
The components of visibility
Visibility is the ability to peel back system layers to gather useful information. Monitoring tools and practices play a vital role, providing the scope and depth needed to gather health, security, hardware and host OS data. The choice of tools and specific data gathered depends on monitoring goals and how the data will be used. Thus, visibility involves tools and policies:
- Tools are the software applications used to gather data. This can involve a range of native vendor or third-party tools, as well as single-point or multipoint tools. Tools provide the instrumentation that gathers data from systems, networks, applications and platforms. AI systems play a greater role in aggregating and analyzing data.
- Policies focus the data gathering needed for visibility and define how data is secured, used and retained. Policies help prevent an organization from collecting everything and keeping it forever, which can turn an ocean of data into a swamp of visibility and analytics.
The benefits of observability
Observability can bring numerous benefits to the enterprise:
- Better end-user experience. The primary benefit of observability is improving UX or CX by focusing operations tasks on issues that threaten that experience. Proper application of observability can improve application availability and performance.
- Faster troubleshooting and issue remediation. Observability practices will also typically reduce operational costs by reducing downtime and speeding up handling of adverse conditions. This happens by reducing irrelevant or redundant information and prioritizing notifications of critical events. These improvements are most noticeable in large enterprises, where large operations teams are required.
- Better workload performance and availability. Some users report that observability practices provide information that is helpful in reliability and performance management, and even in infrastructure design and tool selection. This is because a focus on truly critical information helps identify vulnerabilities that can be corrected by changing configurations, application design and resource levels.
- Enhanced automation. The emerging role of analytics and AI in enterprise operations enables observability efforts to bolster AI-driven automation initiatives, such as anomaly detection in security, optimizations in resource provisioning and cost management, or root cause analysis in troubleshooting.
The challenges of observability
Observability comes with various challenges, including the following:
- Accidental invisibility. Failing to properly filter or structure data sources that compete for attention can lead to accidental invisibility of important events and data. This can cause a critical condition to go unnoticed because it's hidden from view or from processing.
- Complexity. Modern enterprise workloads can be complex and change rapidly, such as microservices, and involve numerous dependencies, such as Docker and Kubernetes. Complex systems can be particularly difficult to observe in real time, real-world situations.
- Tools and overhead. Observability can demand a variety of tools. More tools can add overhead and further complexity to the environment, impacting application performance and reliability. Practitioners must carefully evaluate the variety and overhead of tools involved when approaching an observability project.
- Lack of source data. Not all important information is collected, particularly at the application level and as it relates to workflow tracing. Unlike resource or component status, workflow traces usually require special software modifications to enable.
- Multiple information formats. It can be difficult to assemble the right information and interpret what's available when the same type of data comes in different formats from different sources. An organized strategy for structuring information into a standard form is required to ensure optimal observability. AI can help ease data formatting and analysis, but it's still a challenge worth considering.
- Security and compliance. Observability data collected by tools can contain sensitive business data. This data might demand robust privacy and security controls for storage, access and retention. Consider any prevailing compliance requirements for observability data.
How to implement observability
Observability starts with a plan, then moves to an architecture and finally to an observability platform. It's important to follow this approach to reduce the risk of challenges and complications.

Observability business strategy
An observability plan begins by identifying the specific business benefits desired. Then, it links each benefit to a description of the data needed to achieve it. Although it's important that this linkage considers available data from monitoring and telemetry, it's equally vital to identify information that isn't currently gathered -- or that is gathered in a system that isn't contributing its data to observability analysis.
Architect the observability relationships
The observability architecture is a diagrammatic representation of the relationships between source data and the presentation of data to operations personnel as well as AI and ML systems. All data sources must be identified, along with the information that each source is expected to contribute. Above the data sources, the diagram should identify the tools that collect, store and present the information, the tool choices for data analysis and filtering, and the tool choices for data presentation (visualization). Both proprietary and open source tools for monitoring and observability are available; it's best to catalog the options that suit the specific target missions at this point.
Select observability tools
The next step in implementation is a specific observability toolkit or an observability platform. The difference between the two can be subtle:
- A toolkit is a set of monitoring tools or features that can be used to support observability but rely on a human operator or a separate software layer to support collective analysis. A toolkit approach will usually require considerable customization but will accommodate existing software and data sources.
- An observability platform is an integrated software application that collects information, performs analysis that includes KPI derivations and presents actionable results to operations users. A platform might still require customization to accommodate all available data sources, and it also might constrain how data is integrated.
Design data processing and storage
Workloads must then be instrumented to provide observability data. This might involve SDKs, such as OpenTelemetry, within applications and agents (sidecars) so that the IT infrastructure can generate observability data. However, observability can produce enormous amounts of data from a variety of new and existing tools. Voluminous data will affect data storage resources and network bandwidth, and it might require a significant amount of additional computing power to process and present meaningfully. It's critical to consider the impact of observability on IT infrastructure and implement security measures -- such as strong authentication and encryption -- to safeguard observability data, which can have significant value to the business.
The value of observability depends on taking these four implementation steps in an organized way. Skipping or skimping will put the concept -- and the investment in it -- at risk.
Choosing observability tools and dashboards
Observability is driven by data using logs, metrics, traces, events and profiles. Consequently, observability tools offer a wealth of features and functionality, each typically focusing on some aspects of IT and the application environment. Regardless of the specific use case, typical observability tools share several common capabilities, and the tool should be able to perform these actions:
- Generate native data, with or without the use of associated agents.
- Ingest data produced from other monitoring or telemetry tools, such as logs.
- Store and retrieve large volumes of data efficiently.
- Process large volumes of disparate data to generate meaningful relationships or insights.
- Visualize data and resulting analytics in configurable real-time dashboards.
- Produce meaningful reports, track long-term trends and send important alerts.
An observability tool can use these fundamental capabilities to offer a wide range of detailed services, such as the following:
- Monitoring the infrastructure -- both locally and in a cloud -- to oversee the activities of containers, pods and networks, or aid in root cause analysis and fault isolation or troubleshooting.
- Tracking applications and microservices to offer insight into application performance and availability, or applications and infrastructure.
- Supporting application security with vulnerability detection, alerting and even remediation.
- Offering business analytics and insights that correlate to the operational environment and projecting the risks and challenges of changes.
Organizations can choose from many available observability tools, but these are some of the most popular open source and proprietary options:
- Chronosphere.
- ContainIQ.
- Cribl Stream.
- Dash0.
- Datadog.
- Dynatrace.
- Elastic Observability.
- Grafana Stack.
- Honeycomb.
- IBM Instana Observability.
- LogicMonitor.
- Monte Carlo.
- New Relic.
- OpenTelemetry.
- Prometheus.
- SigNoz.
- Splunk AppDynamics.
- Splunk Observability Cloud.
- Sumo Logic.
Ultimately, the choice of observability tool depends on the organization's observability needs, integrations -- data sources -- and budget. Prudent IT and business leaders narrow the list by considering the specific feature set of each tool and then test each final candidate in proof-of-principle projects before making a final tool implementation choice.
Ensuring observability across the organization
Making the decision to pursue observability is a good start, but actually ensuring observability can pose significant challenges for the business. Observability must ingest and process an enormous amount of data, then perform analytics to provide clear, actionable outputs. But the sheer volume of raw data -- especially from multiple sources -- makes analytics difficult, and the resulting output has little value if it doesn't tell the business anything it wants to know. A business can boost the effectiveness and efficiency of its observability initiative through several best practices:
- Set goals for observability. Understand what's being observed and why, and what benefits are intended for the business through observability.
- Curate data for observability. Generate or ingest data relevant to the established goals, and don't bother with nonessential data. Add automation to improve speed and consistency in data collection, alerting and incident response.
- Optimize data for observability. Review data sources and consider adding context or altering data collection to benefit observability, such as adding details to logs. This might include aggregating or rolling up some data to more easily see trends in a time series. Pay close attention to data quality -- accuracy, completeness, relevance and timeliness -- to ensure data sources offer meaningful input for analytics and reporting.
- Seek meaningful and actionable outputs. Details can easily get lost in the noise of daily business, so look for meaningful data to produce actionable outputs, such as user effects on services and applications. Rely on evolving technologies, such as AI, for powerful context-driven and adaptive analytics and recommendations.
- Configure outputs appropriately. Configure reporting, alerting and dashboards to deliver meaningful, actionable outputs. For example, rather than setting static alerting thresholds, configure time parameters that might forego an alert if the parameter returns to normal within a given time. This can reduce unnecessary noise.
- Consider recipients. Make sure that outputs are directed to the proper channels. For example, reports might go to one admin, noncritical alerts might go to another admin and critical alerts might be directed to a third admin. This ensures the right people see the right outputs and nothing is ignored.
Stephen J. Bigelow, senior technology editor at TechTarget, has more than 30 years of technical writing experience in the PC and technology industry.
Tom Nolle is founder and principal analyst at Andover Intel, a consulting and analysis firm that looks at evolving technologies and applications first from the perspective of the buyer and the buyer's needs. By background, Nolle is a programmer, software architect, and manager of software and network products. He has provided consulting services and technology analysis for decades.
Continue Reading About What is observability? The ultimate guide for IT teams
Dig Deeper on IT systems management and monitoring
-
![]()
Chronosphere details mechanics of modern approach to observability
By: Adrian Bridgwater
-
![]()
Datadog shops: AI incident management needs platform engineers
By: Beth Pariseau
-
![]()
Why AI is forcing enterprises to rethink observability
By: Marc Ambasna-Jones
-
![]()
7 observability best practices to improve visibility, performance
By: Clive Longbottom