What is distributed tracing?

Distributed tracing is a method used to track the journey of requests as they flow through a distributed system or a microservices architecture.
In modern applications, a single end-user action triggers a cascade of requests across numerous independent services, databases and external application programming interfaces (APIs). Distributed tracing provides visibility into this complex web of interactions as they flow from front-end to back-end devices and services. It helps software developers and other teams identify performance bottlenecks, troubleshoot errors and optimize system performance.
Why is distributed tracing important?
Distributed tracing provides end-to-end visibility into how requests flow through complex systems, particularly in microservices and cloud-native architectures. These are systems where a single user action can initiate interactions across numerous services and servers.
In the past, tracking transactions with monolithic applications was easy. However, the shift to service-oriented architectures has increased complexity, making it harder to identify latency issues. This lack of visibility also led to collaboration problems and blame-shifting among teams during problem-solving efforts.
To address these challenges, organizations recognized that developing in-house options is costly and slows innovation. Distributed tracing emerged as a response, providing better insights into performance issues in microservices environments.
This article is part of
What is APM? Application performance monitoring guide
How does distributed tracing work?
Distributed tracing enhances observability in complex, distributed systems by tracking requests as they traverse multiple services. Here's how it works:
- Every incoming request is assigned a unique identifier known as a trace ID. This ID remains consistent as the request travels through various services, enabling the tracking of its journey across the system.
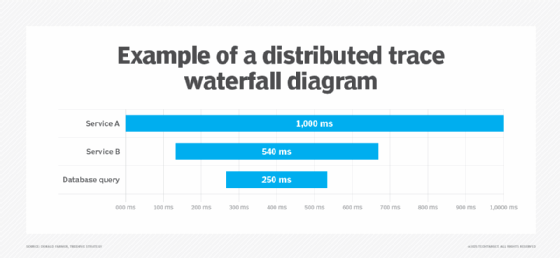
- As a request navigates through a series of interconnected services, each service produces a span or record that details the operations executed. The span includes precise timestamps marking the start and end of each operation, along with important metadata that provides context and insight into the process. Collectively, the spans represent the entire lifecycle of the request, offering a comprehensive view of its journey through the system.
- Spans are organized hierarchically, with parent spans representing overarching operations and child spans detailing suboperations. This hierarchy illustrates the sequence and dependencies of operations across services.
- To ensure trace continuity, context propagation passes trace and span identifiers along with requests as they traverse between services. This is typically accomplished by including trace information in the headers of network requests.
- Once all spans related to a trace are collected, they're combined to reconstruct the full request path. This combination provides a complete view of the request's journey, helping to identify performance bottlenecks and errors.
Types of distributed tracing
Distributed tracing comes in several forms, each serving a different purpose. Here are some common types of distributed tracing:
- Code tracing manually tracks and inspects the execution flow within an application's source code. It's granular, showing function calls and logic, and it helps developers understand the logical flow, identify issues and optimize code performance.
- Program tracing is a part of application performance monitoring. It monitors the execution of entire applications, not just individual code snippets, looking at how different components and modules interact. Program tracing is useful for debugging and performance analysis at the application level.
- End-to-end tracing provides a comprehensive view of a request's journey across multiple services, capturing all spans that correlate and their relationships. End-to-end tracing is essential for understanding system behavior, identifying performance bottlenecks and troubleshooting issues.
Distributed tracing vs. logging
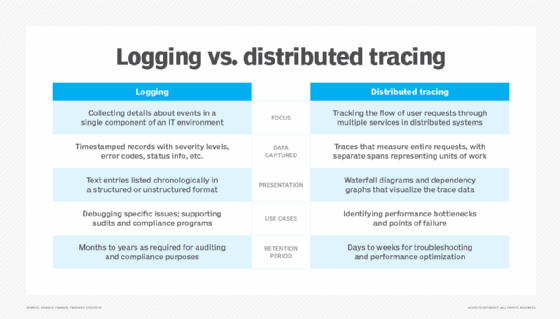
Distributed tracing and logging are both essential for observability in modern systems, but they serve different purposes. Distributed tracing offers a detailed view of a request's journey through various services, recording the flow and timing of each interaction. This helps teams identify performance bottlenecks and understand service dependencies more effectively.
Unlike distributed tracing, logging records individual events or messages generated by applications and systems, such as errors, warnings and informational updates. Log files provide detailed observability metrics about specific incidents within a service, which is valuable for debugging and monitoring.
While logging provides granular data, it lacks the contextual flow information that distributed tracing offers. Together, these tools complement each other, with distributed tracing mapping the journey of requests across services and logging providing detailed context for individual events.
Benefits of distributed tracing
In microservices architectures, distributed tracing offers a range of benefits that are valuable to operations, DevOps and site reliability engineering. Benefits of distributed tracing include the following:
- Faster issue detection and resolution. By providing a comprehensive view of a request's journey across services, distributed tracing lets teams identify and resolve issues quickly. Real-time monitoring through distributed tracing enables rapid detection of performance issues and potential breaches. For example, when a performance issue is reported, teams can examine the traces to identify the service or operation responsible for the slowdown.
- Improved application performance. Distributed tracing helps identify performance bottlenecks and areas for optimization within the system. By analyzing the time spent on each service, developers focus on optimizing the slowest parts of the request flow.
- Improved collaboration and productivity. In microservice architectures, distinct teams manage services, and error identification can be challenging. Distributed tracing provides an end-to-end view of request flows. This enables teams to pinpoint issues quickly, improve response times and collaborate effectively through a shared understanding of service interactions and telemetry data, such as logs and traces associated with each request.
- Enhanced visibility into complex systems. Distributed tracing offers a comprehensive view of how various services interact and depend on each other. This knowledge is essential for troubleshooting, performance optimization and capacity planning in distributed environments.
- Maintenance of service-level agreements (SLAs). Distributed tracing offers detailed visibility into request performance and enables the monitoring of key metrics, including latency, error rates and throughput across services. This helps organizations ensure SLA compliance and a reliable user experience.
- Accelerated time to market. By improving the visibility of processes, distributed tracing enables organizations to achieve operational efficiencies and build a more innovative culture. This, in turn, lets companies bring new products and services to market faster, provide better customer service and respond quicker to market changes.
Drawbacks and challenges of distributed tracing
While distributed tracing enhances observability in microservices architectures, it also presents the following challenges:
- Implementation complexity. Integrating distributed tracing requires instrumenting every service within a system to capture the flow of requests -- a complex and time-consuming task. This often requires significant coordination among various development teams to guarantee a uniform deployment across all services, potentially leading to organizational hurdles in alignment and execution.
- High data volume and storage costs. Tracing generates substantial data, leading to increased storage requirements and associated costs. Storing and processing large amounts of trace data can be particularly expensive for organizations with high traffic or complex systems. To avoid overwhelming storage systems and incurring unnecessary expenses, organizations should manage this data effectively.
- Increased latency. Collecting and transmitting trace data can introduce additional latency to the system. This is especially problematic for real-time applications where performance is critical.
- Steep learning curve. Analyzing and interpreting trace data requires specialized knowledge and skills. Most teams working with distributed tracing require training to properly use distributed tracing tools and derive actionable insights from them.
- Security and privacy concerns. Sometimes, traces contain sensitive information, such as user IDs or internal service details. Without proper controls, there's a risk of data exposure, which could lead to privacy violations or regulatory breaches.
- Inaccurate timestamps. Inconsistencies in the clocks of different machines on distributed systems can lead to inaccurate ordering and timestamp information within traces, making analysis difficult. Proper clock synchronization is essential.
- Digital transformation complexities. Digital transformation makes IT environments more complex. As a result, organizations increasingly rely on advanced distributed tracing options to maintain effective visibility, observability and system management, which can be challenging.
Distributed tracing best practices
Setting up distributed tracing effectively requires careful planning and adherence to best practices. The following are some best practices that organizations should adopt for distributed tracing:
- Standardizing instrumentation. For comprehensive systemwide tracing, organizations should adopt a consistent instrumentation strategy across all their services. Standard libraries or frameworks, such as OpenTelemetry, help maintain this consistency.
- Adopting sampling strategies. To manage data volume and system performance, employing data sampling techniques, such as probabilistic, rate-limiting or adaptive sampling, is helpful. For instance, tail-based sampling captures traces after their completion, ensuring that traces with errors or unusual latency aren't missed.
- Defining clear trace contexts. Organizations should use unique trace IDs to monitor requests as they move through the system. It's essential to ensure that these IDs are consistently propagated across all services and components. Additionally, including span IDs to represent individual operations within a trace enables detailed analysis of each step in a request's lifecycle.
- Integrating with logs and metrics. Organizations should use distributed tracing with logging and metrics to create a holistic observability stack. Traces provide high-level insights, while logs and metrics offer detailed diagnostics.
- Following consistent naming conventions. Organizations should use clear and consistent naming conventions for spans, services and operations to make it easier to interpret trace data and identify issues. For example, spans should be named based on the action they represent, such as HTTP GET /users.
- Ensuring data security and compliance. Organizations should protect sensitive information within trace data by enforcing encryption for data both in transit and at rest. They should also adhere to relevant data privacy regulations to maintain compliance and safeguard user data.
- Monitoring and optimizing performance. Organizations should continuously monitor the performance of their tracing system to ensure it doesn't introduce significant latency or resource overhead. They should also balance the level of detail captured with the system's performance requirements to optimize trace data collection.
- Training teams. Teams should be trained to interpret trace data and use distributed tracing tools effectively. A well-informed team is better equipped to extract meaningful insights from tracing and respond to issues more quickly.
- Iterating and improving. Distributed tracing should be treated as an ongoing process. Organizations should regularly review and refine their tracing strategy in response to system changes, emerging challenges and team feedback.
Distributed tracing tools and vendors
According to research by Comparitech and Informa TechTarget's own analysis, the following are some open source and commercially available distributed tracing tools:
- Datadog enables organizations to visualize the path of requests as they move through their distributed systems, from front-end devices to back-end services and databases. Datadog collects detailed timing information and metadata for each span within a request's lifecycle, enabling developers to identify performance bottlenecks, errors and dependencies in complex microservices architectures.
- Dynatrace offers a distributed tracing tool that automatically captures trace data, including detailed performance metrics and root cause analysis, with AI-powered insights to detect anomalies and performance issues. It also integrates seamlessly with other observability tools and offers real-time monitoring for both cloud-native and hybrid infrastructures.
- Honeycomb offers distributed tracing designed for microservices. It provides real-time analysis and supports anomaly detection. This lets teams gain immediate insights into application performance. Honeycomb provides compatibility across multiple cloud vendors, including Amazon Web Services, Microsoft Azure and Google Cloud.
- IBM Instana offers a distributed tracing tool, part of its observability platform, that automatically tracks requests in complex microservices environments without any manual code changes. This tool offers a real-time, end-to-end view of request flows, letting teams quickly identify performance bottlenecks and gain a detailed understanding of service dependencies, down to the code level.
- Jaeger is an open source tool developed by Uber and is now a Cloud Native Computing Foundation project. It provides end-to-end visibility into microservices architectures for monitoring and troubleshooting workflows. Jaeger offers performance optimization and root cause analysis, making it a popular choice for developers looking to get application insights.
- Lightstep specializes in real-time trace data processing, offering dynamic visualizations and root cause analysis. It's ideal for applications dependent on external services, as it measures system latency in comparison to calling services.
- New Relic enables users to track requests as they propagate through complex, distributed systems. It offers a unified observability platform that enables real-time monitoring and troubleshooting across complex systems. It also offers flexible sampling options to manage the volume of trace data collected.
- Zipkin is another open source distributed tracing system that helps gather timing data to troubleshoot latency and performance problems in microservices. It offers a simple interface for visualizing traces and is commonly used across various programming environments.
What to look for in an enterprise distributed tracing tool
When selecting an enterprise-grade distributed tracing tool, it's important to evaluate several features to ensure comprehensive observability and effective performance monitoring. Key aspects to consider include the following:
- End-to-end transaction visibility. Organizations should invest in a tool that provides a complete view of requests as they traverse all services in the distributed system, from the user's initial interaction to the final response.
- Automated instrumentation. While manual instrumentation might be necessary in certain cases, an effective distributed tracing tool provides automatic instrumentation across various popular languages, frameworks and libraries to reduce manual effort and guarantee comprehensive coverage.
- Scalability and performance. Enterprise systems often have highly distributed and high-traffic environments. The distributed tracing tool must handle large volumes of trace data without performance degradation.
- Real-time visualization and analysis. A distributed tracing tool should offer intuitive dashboards and visualizations, such as Gantt charts and heat maps, to quickly identify performance issues and anomalies. This enables prompt troubleshooting and decision-making.
- Clear and consistent naming conventions. Organizations should look for a distributed tracing tool that promotes clear and consistent naming conventions for spans, services and operations to ensure easy interpretation of trace data.
- Security and compliance. Organizations should ensure that the tracing tool adheres to security best practices, including data encryption and access controls. These are vital for protecting sensitive information and maintaining compliance with relevant regulations.
Distributed tracing provides deeper visibility than traditional logging, but it can add complexity and affect performance if not executed carefully. Consider these tradeoffs when getting started with distributed tracing.