
Getty Images/iStockphoto
Considerations when getting started with distributed tracing
Distributed tracing has advantages over traditional logging and monitoring, especially for microservices, but it can also affect application performance through added complexity.

With any new technology comes issues, and containers and microservices are no exception. As DevOps teams move to new platforms for speed and scalability, code, networking and security issues will crop up.
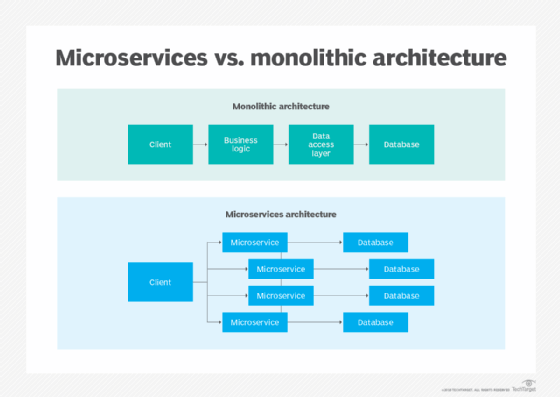
But addressing these problems is more complicated in a microservices architecture than a traditional development stack, as application code is not all in the same place. This makes troubleshooting difficult because traditional monitoring and debugging tools cannot jump from one environment to another.
This is where distributed tracing tools such as Jaeger and OpenTracing come into play. Follow these tips to get started with the distributed tracing method of application monitoring for your microservice environments.
Distributed tracing vs. traditional logging and monitoring
Before considering a distributed tracing tool, it's important to first understand that they are not applications you install and configure like a traditional monitoring tool.
Distributed tracing is similar to log aggregation, where IT teams create the logs and not just the repository. With distributed tracing, IT teams modify the code to make requests so that they can be recorded as the application moves through its stack.
Compared with traditional logging, distributed tracing provides a deeper, more comprehensive view of the distributed application stack, closer to real time. Log aggregation tools, in contrast, can have delays of hours to days.
How distributed tracing works
In distributed tracing, collected data is broken down into parent spans, child spans, traces and trace contexts, which aids in observability.
A span represents a single service in a microservice application. The structure of a span resembles a nesting doll: A child span sits within a parent span, or a single service sits within a microservice application. Several child spans can exist in a parent span within a microservice application.
Together, the overall flow of the span is called a trace. A trace context is the request between different services or the communication between two microservices.
Developers are key when implementing distributive tracing. APIs must be included in the code to create the tags so that callouts can go to a repository for data collection. IT teams can then use these insights into distributed applications to identify where an issue might be occurring.
Third-party vendors offer tools to create data dashboards for easier viewing. A flame graph, for example, can show the spans in a visual stack in a manner similar to a project management chart, displaying the relationship and order of the spans. This can help IT personnel diagnose everything from lag times within a service to communication issues between services.
The level of detail collected depends on how many tags developers put in. APIs are typically available for common programming languages, such as Java, Python, Ruby and C#. Depending on the vendor, each service in a distributed application might use a different language, requiring the programmer to put appropriate tags in the key spots.
Distributed tracing concerns
Distributed tracing can increase overall application creation time. You're not just looking at the code for function; you're looking at it for future troubleshooting.
Adding distributed tracing to an existing application can be difficult. A programmer looking to put the tag callouts in the right spots must understand the entire application stack. This level of effort for troubleshooting might be too much for an existing application.
In addition, creating numerous tags can affect application performance by adding more effort to the application stack and generating large amounts of data, which must be stored somewhere. Even if individual callouts are not large, sizable collections of data are possible with each application stack execution. Choosing how many tags to use requires balancing the amount of data collected with the ability to produce insights, which is not an easy tradeoff.
Choosing a distributing tracing tool
Getting started with distributed tracing tools such as Jaeger or OpenTracing involves more than just downloading the APIs and plugging them in.
First, figure out who will view the data to help determine where and how many tags to use in the application stack. Next, ensure everyone is on the same page with their applications so that every dashboard follows a common set of standards for spans and traces.
Jaeger vs. OpenTracing
Although Jaeger and OpenTracing are both distributed tracing tools, each has a different scope.
Jaeger is a true distributed tracing tool that monitors and troubleshoots microservice applications, whereas OpenTracing focuses on standardizing code to generate and manage the collected data. In addition, OpenTracing is no longer an active project and has been merged with OpenCensus to form OpenTelemetry.