What is Application Performance Index (Apdex)?

Application Performance Index, also known as Apdex, is an open standard intended to simplify reports of application performance.
Apdex analyzes the perceived satisfaction of the application's end user. It is not an application performance monitoring and management (APM) tool.
Apdex numerically scores the level of satisfaction of an end user based on application responsiveness by calculating the degree to which user expectations compare to performance in a fractional 0 (no users satisfied) to 1 (all users satisfied) scale.
The Apdex Alliance
In 2004, a group of software vendors led by NetForecast, a data and internet service provider (ISP) monitoring company, developed and specified the Apdex standard. This group of vendors is called the Apdex Alliance. In 2007, the Apdex Alliance was made up of 200 members, rising to 2,000 individual members in 2010.
Members and vendors included in the Apdex Alliance research and create new standards for how Apdex reports on application performance relating to user experience (UX). Members also contribute to the Apdex technical guide and develop educational guides. Members and vendors included in the Alliance also implement Apdex tools in their software products.
This article is part of
What is APM? Application performance monitoring guide
Because Apdex is not used to monitor software, an Alliance vendor typically gathers metrics such as response times, which are then incorporated into an Apdex score that goes in the monitoring software's dashboard for IT and developer customers. Scores are not exclusive to vendors that are a part of the Alliance.
Application responsiveness in three zones
Apdex ratings are based on three levels of responsiveness, through the perception of the end user:
- satisfied
- tolerating
- frustrated
The specific score can be separated into excellent, good, fair, poor and unacceptable; these five scores can be thought of as A, B, C, D and F grades.
Responsiveness in software, in part, is determined by application response time and transaction processing. Application response time is the time between a user-initiated or completed task and when the software responds for the next task. Transaction processing interprets individual information as operations.
In the Apdex score, responsiveness is indicated as a value of T or F. T is the value for when response is considered to be quick, and F is when the system is too slow. T stands for time in seconds.
An Apdex score can range anywhere from 0 to 1, such as 0.5, 0.8 or 0.95. Satisfactory responsiveness indicates when a user is fully productive; the best possible score is a 1. Tolerated responsiveness is when a user would notice performance lagging. Frustrated responsiveness is a response time greater than what is seen as acceptable for T; the worst possible score being 0.
How Apdex scores are calculated
The equation Apdex uses to find a responsiveness score is the number of satisfied samples, plus half the tolerated samples, divided by the total sample number. Written out, the equation looks like:
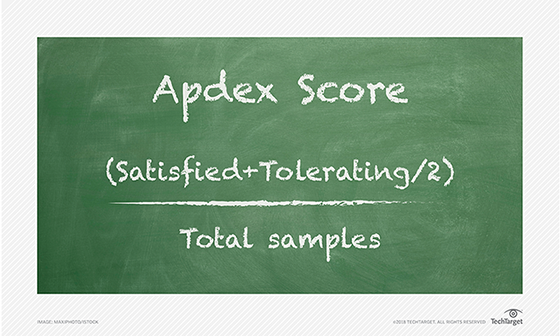
For example, a system with 100 total users has 70 satisfied users, as defined by the application's high responsiveness. This is a T value of 70. There are 20 users with slower responses from the application, but within acceptable range, so they are tolerating users. The equation is (70+20/2)/100= 0.8.
The 0.8 score falls between 0 and 1. An excellent score falls in 1.00-0.94, a good score ranks from 0.93-0.85, a fair score hits 0.84-0.70 and a poor one between 0.69 and 0.49. Any lower number is unacceptable.
How to improve Apdex scores
An organization must define a benchmark response time for its application and what response times need to be reached for the each working part of that system. Faster response time will yield more satisfied users and a higher Apdex score.
Behind Apdex scores are distributions in values, such as response time, which can be plotted in seconds as a histogram. In the histogram, values could appear on the long tail of a falling curve, not as easily caught with metrics such as the mean or median response time, but visible with Apdex.
If a long tail is detected, developers should analyze the application architecture for poor performance indicators. The application deployment setup also directly affects performance. For example, an application can be redesigned to communicate less over the network, or it can be allocated more network bandwidth, both of which should improve performance.
Other Apdex use cases
While IT organizations use Apdex to determine the responsiveness of enterprise software, it also has uses outside of application management.
For example, NetForecast used the Apdex equation to audit the accuracy of a Cox internet usage meter, with the specification of the meter being accurate within ±1%. Within ±1% means all samples are satisfied, below -1%, all samples are tolerated, samples above +1% are frustrated. During the year the meter was measured, the Apdex score was mostly in the good range and intermittently rose to an excellent score.
A nontechnical company can use Apdex scores as well. For example, a news organization can ask if an article was useful, somewhat useful or not useful, and derive a score from the replies plugged into the Apdex equation.