Understanding the fundamentals of LLM observability
LLM observability involves specialized monitoring to enhance performance, debugging and cost management. Learn to use the five pillars of LLM observability to manage AI deployments.
Observability is crucial for understanding and enhancing performance in large language model applications, as well as for ensuring efficient debugging.
Prone to model drift, AI deployments can generate responses that gradually degrade in accuracy. Achieving adoption success requires consistent data-driven maintenance and fine-tuning.
At the same time, IT operations workflows can face challenges due to resource bottlenecks, inefficient data pipelines and complex troubleshooting procedures. Tracking the quality of model responses, detecting hallucinations in advance and managing token costs are all important operational goals. However, they're unattainable without a scalable observability framework for continuous improvement.
For organizations with significant resources, a custom large language model (LLM) observability tool can provide tailored evaluations and integrations. Smaller startups or those without extensive infrastructures might find off-the-shelf tools sufficient for initial stages. However, these might lack the depth necessary for scaling or long-term growth.
The 5 pillars of LLM observability
LLM observability provides a specialized approach that incorporates performance metrics, data-driven internal analysis and overall model transparency to maintain high-functioning AI deployments. Organizations adopt LLM observability to overcome key challenges related to debugging, output quality, cost overruns and model performance over time.
Traditional monitoring tracks system-level metrics, such as CPU usage, memory and request counts, so that IT teams can monitor system health, proactively identify issues and ensure optimal resource usage.
LLM observability expands on these capabilities by including semantic reviews of model outputs, analysis of token usage patterns and alignment with business goals. The five pillars of LLM observability ensure that data inputs and outputs are accurate and handled responsibly using real-time evaluations that scale as AI models mature.
1. Evaluation
The first pillar is based on clear evaluation standards. These include technical, semantic and user-based analysis, as well as cost efficiency tracking and end-to-end traceability.
On the technical end, administrators need to know why an AI agent spiraled, model responses deteriorated or costs increased. Explaining why an output succeeds or fails is more achievable when models and evaluations are transparent.
While traditional IT logging frameworks offer IT accountability, LLM observability frameworks focus on model-specific parameters, such as prompt quality, model responses, input/output token counts and request tracing. These provide critical insights into functionality.
For example, administrators use semantic observability to evaluate response accuracy, relevance, consistency and integrity, while using the framework to assess the quality of UX and real-world application effectiveness. IT teams can control costs by employing statistical performance baselines, ensuring that models remain within budget and achieve AI deployment goals.
2. Traces and spans
The second pillar focuses on the evolution of system requests using traces and spans. Traces capture the journey of a request as it passes through a distributed system. A trace describes the complete arc of a request as it moves from start to completion and delivers the targeted response. Spans represent the foundation of traces, with each span defining a unit of operation within that journey. Database queries, API calls or function executions can all be isolated as spans to find resource bottlenecks and gauge the speed of a service or function response.
3. Retrieval-augmented generation
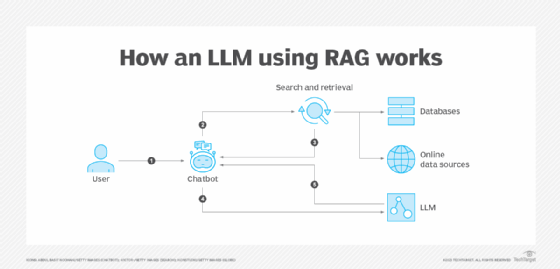
IT teams rely on the third pillar, retrieval-augmented generation (RAG), to verify information based on external knowledge and improve monitoring and evaluation of an AI model's performance. LLM applications are composed of multiple relay components, including retrieval systems, prompt templates and external APIs. RAG offers end-to-end traceability to enhance delivery pipelines and meet data compliance and governance.
Retrieval-augmented generation enables AI models to produce more accurate, relevant and informed responses.
4. Fine-tuning
Administrators and engineers employ the fourth pillar, fine-tuning, to customize an LLM instance using specific data sets that improve overall performance and task execution. Once LLM observability is in place, IT teams can monitor the impact of fine-tuning on model performance and identify areas where further adjustments are necessary.
5. Prompt engineering
Prompt engineering represents the fifth pillar. It involves applying methods, techniques and established practices to develop LLM prompts. For example, a prompt engineer crafts the design and makeup of the prompts and then develops key interactions with the LLM. The process requires considerable time making API calls, testing features, performing safety checks and clearly understanding how LLMs respond to certain queries.
Key characteristics of effective LLM observability tools
Several LLM observability tools are available to capture emergent model behavior, provide visibility into token consumption, and identify inefficient prompts and unnecessary model calls. These include open source options and proprietary and custom enterprise-level LLM observability tools that offer common characteristics and features.
Performance monitoring
LLM performance monitoring is crucial for visualizing metrics, creating unified dashboards and setting up alerts to track overall functionality. Administrators and IT teams can gain a broad view of model infrastructure by monitoring system metrics that indicate latencies, request throughput, error rates and overall resource utilization. Useful tools that offer dashboard control of resources include Prometheus, Grafana and Datadog.
Debugging
Difficulty in debugging LLM applications is due to the sheer complexity of the undertaking and the number of variables involved in RAG pipeline analysis and advanced LLM reasoning chains. If failures do occur, analysts and engineers can employ debugging tools across a range of areas -- not only to identify performance bottlenecks and understand model reasoning patterns, but also to optimize prompts, set up privacy guardrails and perform root cause analysis of slowdowns. Tools such as OpenLLMetry are geared specifically to helping administrators view the entire lifecycle of a request, as well as automating instrumentation to simplify monitoring.
Error tracking
Error tracking represents another critical must-have in LLM observability frameworks. Developers use error tracking to monitor, troubleshoot and optimize LLM applications. IT teams require deep observability capabilities, especially around prompt stacks, inputs and outputs, RAG chains, model performance and regressions.
Visibility
Administrators can pinpoint the source of a problem using identification, logging and error management to detect patterns and anomalies. While it's important to monitor metrics on error rates, visibility into trace execution is also a prerequisite. Ensuring an LLM observability framework can handle both error tracking and tracing is crucial. Langfuse, LangSmith, Arize Phoenix and Helicone are some examples of comprehensive vendor-based and open source tools.
Consider implementing LLM observability pipelines based on clear business rules, SME acceptance criteria and domain-specific benchmarks.
Evaluation data and benchmarks
LLMs can produce an infinite number of response variations and inadvertently produce biases. Custom and off-the-shelf observability tools offer bias benchmarks to determine plausibility and ensure factually correct responses.
While manual evaluations might be inefficient at scale, subject matter expert (SME) analysis can assess subtle indicators of model output, including tone, contextual appropriateness and adherence to brand standards. Observability tools can offer granular evaluation data to determine how LLM models perform based on end-user inputs versus training data. Arize AI, Comet ML and Giskard each offer specific features for benchmarking bias in LLMs.
Achieving practical results with LLM observability
As companies look toward LLM adoption and use cases, they should consider implementing LLM observability pipelines based on clear business rules, SME acceptance criteria and domain-specific benchmarks. Once these are in place, engineers can test their LLMs against preestablished standards to determine how well a model compares against previous benchmarks and standard data sets.
In some instances, administrators can evaluate an AI deployment's ability to meet benchmarks by deploying a simpler, more focused model to score the output of the primary LLM. This is known as the LLM-as-a-judge approach.
Ultimately, without specialized LLM observability frameworks in place, organizations risk operational blind spots that often lead to model unpredictability, hidden quality issues and eroded trust in AI performance.
Kerry Doyle writes about technology for a variety of publications and platforms. His current focus is on issues relevant to IT and enterprise leaders across a range of topics, from nanotech and cloud to distributed services and AI.