Part of:Data observability boosts data pipeline performance
The 5 pillars of data observability
Data observability provides complete oversight of an organization's data pipeline. Use the 5 pillars of data observability to ensure efficient, accurate data operations.
As organizations collect and analyze more data, data pipelines are getting bigger and more complex. Data observability is critical for managing the growing volume of data.
Data observability provides organizations with end-to-end oversight of the entire data pipeline and monitors the system's overall health. If it identifies any errors or issues, the software alerts the right people within the organization to the area that needs addressing.
"Analytics and data projects are very heavily dependent on the data preparation and pipeline processes," said David Menninger, executive director and analyst at ISG Research. "We have enough info to know what the data should look like. If the current run of that pipeline doesn't match that shape, that's an indication that maybe there's an issue."
Data observability has been growing in prominence, especially as AI technologies continue to dominate the IT market. Without sufficient data observability, AI models and agents are at risk of continually producing incorrect responses without intervention. Proper data observability can help spot these errors before they put the business at risk.
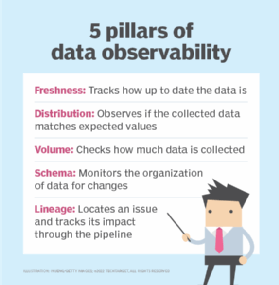
Data observability focuses on five pillars to make data management more effective and improve overall data quality: Freshness, distribution, volume, schema and lineage.
Each pillar covers a different aspect of the data pipeline and complements the other four.
1. Freshness
Freshness tracks how up-to-date the data is and the frequency with which the data is updated. Confirming data is both updated and coming in at the appropriate rate is particularly useful when it comes to data governance and data catalogs.
"[Freshness] is probably the most closely reported; it's a gross indicator of whether there's an issue," Menninger said. "Data catalogs have become very popular … and typically report freshness."
Using the wrong numbers or not knowing why numbers negatively impact machine learning models undermines data-driven decision-making. Using a data observability tool that automates data freshness checks can free up vital staff hours and save costs.
The five pillars of data observability
2. Distribution
Distribution is the expected values of data that organizations collect. If the data doesn't match the expected values, it may indicate an issue with data reliability. Extreme variance in data also indicates accuracy concerns.
Data observability tools can monitor data values for errors or outliers that fall outside the expected range. They can alert the appropriate parties about inconsistencies to address issues quickly before those issues affect other parts of the pipeline.
Data quality is an essential part of the distribution pillar because poor quality can cause the issues that distribution monitors for. Inaccurate data -- either erroneous or missing fields -- getting into the pipeline can cascade through different parts of the organization and undermine decision-making. Distribution helps address problematic elements if the data observability tool detects poor quality.
3. Volume
Volume tracks the completeness of data tables and, like distribution, offers insights into the overall health of data sources. Organizations know where they collect data from, when the data is gathered and information about products, accounts and customer data.
For example, if a table containing the 50 U.S. states is reduced to 25, something is wrong.
It's great to observe an issue. That doesn't do you much good by itself. Observability needs to include remediation.
David MenningerSenior vice president and research director, Ventana Research
4. Schema
Schema monitors the organization of data, such as data tables, for anomalies or breaks. Rows or columns that are changed, moved, modified or deleted can cause breaks and disrupt data operations. The larger the databases in use, the more difficult it can be for data teams to pin down where the break could be.
"Schema is an indicator your pipelines need to be modified," Menninger said. "The information could be used for some amount of automated remediation."
5. Lineage
Lineage is the largest of the pillars because it encompasses the entirety of the data pipeline. It maps out the data pipeline, where the sources come from, where the data goes, where it's stored, when it's transformed and the users it's distributed to.
Lineage enables an organization to examine each step of the data pipeline, revealing how issues in one part affect other areas. When there's an error within the pipeline, lineage provides a holistic view for IT or the data team to look at the big picture and trace not only where the problem is, but also where it originated and what it has affected.
"Lineage is a harder one to assess," Menninger said. "If the type of transformation changes, is that an issue? It may or may not be. There may be a new product that's introduced, so lineage process needs to be modified to recognize the new product code."
In some cases, lineage can trace an issue from further down the pipeline back up to the source in a different part of the pipeline. It can also help track infrastructure costs and answer documentation questions, as well as identify who is using the data.
Observability is a valuable tool for organizations to catch issues, but catching the issue is only half the battle. Any alert should trigger remediation of the issue.
"It's great to observe an issue; that doesn't do you much good by itself," Menninger said. "Observability needs to include remediation. We should be able to automate some of the remediation."
Peter Spotts is the former site editor for TechTarget.
Erin Sullivan is a senior site editor at TechTarget covering data technologies, with a focus on data backup and recovery.