
Getty Images/iStockphoto
Comparing RAM usage across common web browsers
While there are plenty of similarities across web browsers, the processes that they consume RAM with can greatly differ. This may be critical information for some IT teams.

Web browsers can sometimes consume shockingly large amounts of memory, and it's not uncommon for a browser to use multiple gigabytes of RAM.
While this isn't an issue for all organizations, high RAM usage can present issues for end users from a compute resources and productivity perspective. IT administrators should know why memory use tends to be so high for some web browsing sessions, how they can measure it and which browsers use the most memory.
Why do browsers use memory?
Web browsers use memory to cache the various elements that make up a webpage. Although browsers still cache objects to disk, just as they always have, memory caches are faster than disk caches. As such, using a memory cache greatly improves a browser's performance.
Additionally, browsers rarely render static HTML on a page. As such, browsers use memory when performing the various computations that are involved in rendering webpages.
Modern browsers are multithreaded and therefore use multiple system processes. These processes allow for parallel instruction execution, boosting the browser's performance. Each of these individual processes consumes memory, which can add up quickly.
Measuring RAM use with PowerShell
Measuring the amount of memory that a browser is consuming isn't quite as straightforward as it may seem. This is because each browser tab is linked to a separate process and each process has its own memory use. There may also be processes tied to other browser functions in the background. To measure a browser's overall memory use, an administrator must collectively examine all of the browser's processes.
One way the admin can assess a browser's overall memory use is to use PowerShell to examine the processes associated with the browser. The three lines of code report the memory usage for the Edge browser to show an example of one such PowerShell inquiry:
$A = Get-Process | Where-Object {$_.Name -eq 'MSEdge'}

$B = $A.WS | Measure-Object -Sum

$B.sum /1MB
The first line of code creates a variable named $A and associates that variable with all of the running processes named MSEdge. Incidentally, the trick to making this code work with other browsers is to substitute the process name for the desired browser. If an administrator wants to see the individual processes that are referenced within the $A variable and the working set memory consumed by each process, they can enter the $A | Select-Object Name, WS command.
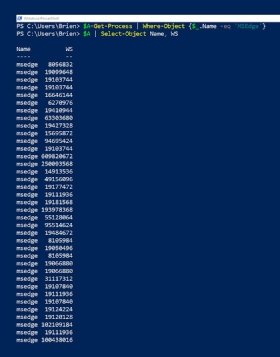
This second line of code measures browser memory use by creating another variable. This variable is called $B and it points to the working set memory usage of the process in question (Figure 1).
The administrator should then pipe this information into the Measure-Object cmdlet and append the Sum parameter. This allows the working set memory used by each of the MSEdge processes to be added together, giving the admin the total amount of memory that the browser is consuming across all of the open tabs. To learn how many processes the browser is using at the moment, just enter $B.
The last line of code displays the total working set memory consumed by the browser while converting the value into megabytes. Without the /1MB portion of the command, the working set memory will be displayed in kilobytes. As an alternative, admins could use /1GB to display the memory use in gigabytes.
Comparing memory use across browsers
Each browser uses memory in a different way, so administrators can't truly get a feel for a browser's memory usage by simply looking at a single webpage or even a few different webpages.
Despite this, a simple test can illustrate the point that browsers use memory in different ways and to different degrees. This case study covers Microsoft Edge, Google Chrome and Mozilla Firefox, all running on a virtual machine. The parameters of this test case are a single open browser tab. Administrators should use the PowerShell code listed above to report on each browser's memory use. The Safari browser was excluded from this test because Apple has not released a PC version of Safari since 2015 and that version is no longer available for download.
Below are the process names associated with each browser in PowerShell.
| Browser name | Process name |
| Edge | MSEdge |
| Chrome | Chrome |
| Firefox | FireFox |
Google Chrome has accompanying crash handler processes that are not included in these metrics.
| Browser name | Browser memory use |
| Edge | 476.56 MB |
| Chrome | 422.91 MB |
| Firefox | 683.66 MB |
The results of these test cases shouldn't dictate which browsers an organization prefers or even allows their users to run, but it can provide insight into how browsers consume this resource to inform decision-making (Figures 2, 3 and 4).

There is some key context for the test cases with Firefox, Chrome and Edge. First, these tests represent point-in-time data. A repeated execution of these tests would likely yield different results.
Another important fact to keep in mind is that when a user closes a browser, the browser's memory is not necessarily released. Shortly after the Edge browser was closed, this test case found five Edge processes still running on the machine.

One last thing to keep in mind is that browser memory usage can increase or fluctuate over time, even if there is no change in end-user actions. The measurements from this exercise were taken immediately after the browser was installed. Sometimes browsers consume more and more memory the longer that they are in use, and this can compound over time.

To illustrate this effect, consider an instance of the Edge browser with a tab open to YouTube. Take that measurement and then close the browser. Repeat this process of opening YouTube a couple more times. A reading of memory use after the repeated opening and closing of the browser will lead to a memory increase, with a clear increase from the first memory reading to the second (Figure 5).

Clearly, browser metrics can vary wildly due to numerous factors. IT teams should never regard individual measurements as the only and absolute reflection on the state of the browser at a particular point in time.