How to perform WVD monitoring with Azure Log Analytics
Like any DaaS offering, Windows Virtual Desktop's success depends on user experience. Learn how to set up the Azure Log Analytics tool and how it can help virtual desktop administrators.
Windows Virtual Desktops is a desktop-as-a-service offering based on Microsoft Azure, and like any virtual desktop technology, it requires extensive monitoring to ensure a quality experience for the end users.
As a WVD administrator, you are responsible for the session hosts and the image they run off. Microsoft takes care of numerous other elements such as delivering and managing the virtual desktops the connection to the desktop, load balancing and brokering.
However, you still must decide how many session hosts to create and what level of performance is acceptable for the end users. You must also ensure that you aren't spending too much on Azure resources that your environment isn't using efficiently.
Find out how WVD monitoring with Azure Log Analytics works and what it takes to set up this monitoring utility.
Azure Log Analytics for Windows Virtual Desktop
Azure Log Analytics is Microsoft's new method to monitor your Windows Virtual Desktop environment without the need for a third-party product. It takes about 10 minutes to set up, but IT administrators must check the requirements first.
Azure Log Analytics requirements
To use Azure Log Analytics with WVD, you will need a WVD environment that is deployed with Azure Resource Manager (ARM). You will also need a Log Analytics workspace and the correct role-based access control (RBAC) rights covering Monitoring Contributor, Log Analytics Contributor and Security Administrator.
Once you set up the WVD monitoring with Azure Log Analytics, it will provide you with three key dashboard views of your deployment. They are the following:
Session Details
The Session Details dashboard view allows you to see which users are signed and if they are active or disconnected. This gives you a quick view to determine the number of concurrent users, and from which platforms the users sign in. A big plus is for this view is the ability to see how many disconnected sessions you have. Disconnected sessions can negatively affect your virtual desktops' performance and unnecessarily raise Azure costs. To fix this, you can change your group policy object settings to automatically sign off disconnected sessions.
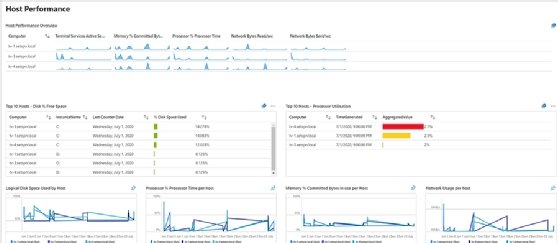
Host Performance
With the Host Performance dashboard, you can see how busy your hosts are within the last couple of hours. The Host Performance monitoring dashboard is also a great WVD tool to see if your environment is scaled correctly. If you see high CPU usage on all hosts, you might want to add an extra host.
The Azure Log Analytics Host Performance dashboard displaying network usage per host, the top processor utilization across all hosts and more.
Disk Performance
With the Disk Performance dashboard, you can monitor your FSLogix profile virtual containers. This way you can easily see if there is a negative effect on latency on your Azure Files or Azure NetApp file storage.
To use Azure Log Analytics with WVD, you will need to have a WVD environment that is deployed with Azure Resource Manager (ARM).
Is Azure Log Analytics enough?
Azure Log Analytics gives a few basic insights into the performance of your WVD environment. These basic insights can be enough for you depending on your organization's needs, but Log Analytics is missing a lot of more advanced features around WVD monitoring compared to third-party tools such as ControlUp or Liquidware Stratusphere UX.
Both of these other tools will show you the user experience score and give you drill-down capability -- showing you what a user is doing and why performance may be suffering. For instance, users could be loading multiple YouTube videos in the virtual environment, which would greatly hinder performance, depending on the business case.
You can always try Azure Log Analytics before subscribing to any other tool, and if it is not enough, you can begin a trial with a third-party product. This should give you the information you need to decide between WVD monitoring tools.
Information in WVD monitoring setup example
These are the Windows Performance Counters you will need to set up Azure Log Analytics for a WVD deployment. They are also the batches used in the video tutorial.