
Getty Images/iStockphoto
How to use Reliability Monitor to manage servers
The utility gives administrators a way to look back over time to see what driver updates, software installations or hardware crashes might be related to the sudden instability.

Windows admins must play detective when server problems occur, but fortunately, they have a variety of tools to find and decipher clues to resolve performance issues.
It's a common scenario for IT: Something worked yesterday, but it doesn't work today. When that happens, the first troubleshooting step is to find out what changed during that time frame. Windows has so many sources of information it can be difficult to pinpoint what you're looking for, but one of the most useful troubleshooting utilities is Windows Reliability Monitor.
What is Windows Reliability Monitor?
When a server seems to be more unstable or underperforming, you need to verify this and determine when the issues happen. While you can pull this sort of information from Event Viewer or Performance Monitor, Reliability Monitor offers an easy interface.
Reliability Monitor uses a graphical interface to show and rate the system's dependability history, including exactly what changed and when, alongside any application or OS crashes. Reliability Monitor can also show information related to updates, software installations or uninstalls, and hardware issues. Reliability Monitor relates crashes to these categories, if possible, to further narrow the scope of the problem to identify where the instability originates.
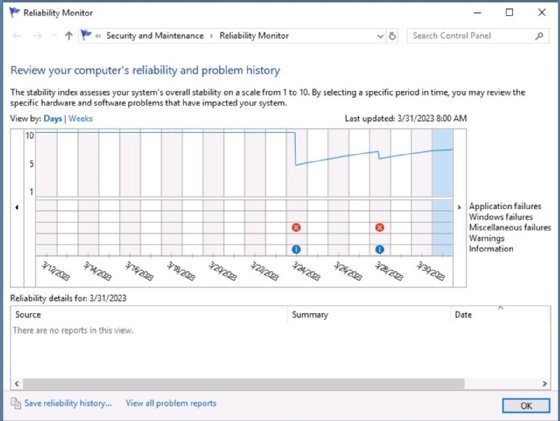
Figure 1 shows the system runs smoothly until March 24 when a new application is installed, and then the system stability dips after multiple crashes occur. A closer look at the history helps to pinpoint the likely culprit.
How to read Reliability Monitor results
Open Reliability Monitor by browsing to Control Panel > System and Security > Security and Maintenance. Or open the Run menu with the Win+R hotkey, and type the perfmon /rel command.
Reliability Monitor only has one interface, and a bar graph dominates most of it. The graph is simple. The vertical axis is a reliability scale from one to 10, and the horizontal axis represents the time range. By default, each column represents one day, but if you select the Weeks link in the upper left, each column spans one week.
The lower-right corner of the graph shows event categories, including warnings and application failures. An event appears under the corresponding day or week, which can reveal any patterns and pinpoint when an issue began.
Select an event in the bottom Reliability details pane to display more information, which typically shows a sentence that describes the issue. The View technical details link rarely offers additional advice.
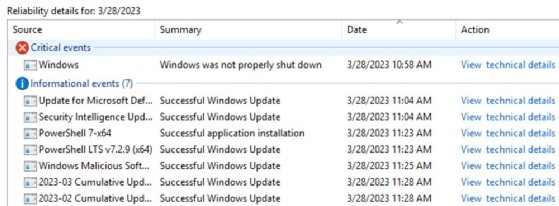
The reliability rating drops for each crash or issue but slowly rises toward 10 as the server demonstrates stability. This information is useful enough for you to try troubleshooting tasks, such as updating or removing the application, rolling back a driver or replacing faulty hardware.
How to save Reliability Monitor results
There are a few other ways you might use Reliability Monitor. The lower-left corner of the tool lets you Save reliability history for server audits or as part of your service-level agreement archives.
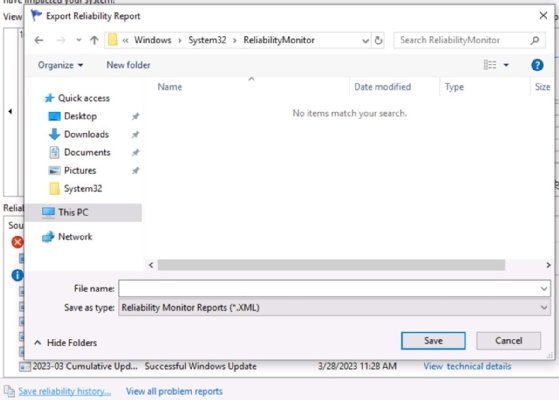
You can consolidate and compare the reliability history for several servers to identify applications or updates on multiple systems to pull together more widespread problems. This valuable troubleshooting information can guide you to determine whether the problem is isolated to a single machine or affects multiple systems. Reliability Monitor saves the history in XML format.
You can configure Windows to send problem reports to Microsoft. In theory, Microsoft uses these reports to identify and address persistent issues with specific tools on hardware. Reliability Monitor provides a link to these reports in the lower-left corner. Select View all problem reports to see a list of incidents sent to Microsoft.
Reliability Monitor is a native tool on supported Windows Server and desktop systems, making it a good option to troubleshoot client devices, as well as your servers. You don't need to install any additional Windows features or enable services to use Reliability Monitor.