
Getty Images
Interpret and apply AWS Compute Optimizer recommendations
It is challenging to find the right balance between performance, availability and cost. Learn how to enable and apply AWS Compute Optimizer to monitor your metrics.

Performance, availability and cost are three essential factors to consider when you design and operate applications in the cloud. The way you prioritize them has a significant impact on your business, application and user experience requirements. Finding the right balance of these factors is a challenging but important process.
AWS Compute Optimizer can help your business strike a balance and operate applications that deliver the right user experience at the right cost. It monitors Amazon CloudWatch metrics and delivers findings using artificial intelligence and machine learning algorithms. It focuses on cost reduction and avoidance of over-provisioning or under-provisioning of cloud resources. As of late 2022, the service supports the following AWS components:
- Amazon Elastic Compute Cloud (EC2) instances
- Amazon Elastic Block Store (EBS) volumes
- AWS Lambda functions
Learn how to enable the tool as well as key considerations when you analyze optimizations for the supported services.
Enable AWS Compute Optimizer
To enable this service, start at the AWS Compute Optimizer console. You can click on the "Get started" button, as seen in Figure 1.
The next page describes the service requirement to have at least 14 days of CloudWatch metrics history and the need to create an IAM service-linked Role.

Once you enable the service, it automatically gathers relevant metrics for all supported services. However, at the time of publication, there is no way to configure specific resources to monitor or to select resources based on tags or AWS Resource Groups.
A feature called enhanced infrastructure metrics applies to EC2 instances. It costs approximately $0.25/month -- billed hourly -- per analyzed EC2 instance. This feature allows the analysis of EC2 metrics up to three months in the past, which improves the accuracy of Compute Optimizer recommendations and findings. However, the default option of the tool doesn't result in any additional costs.
When it comes to analyzing optimizations for each supported AWS service, there are some important factors to consider.
EC2 instances
EC2 offers a wide range of EC2 instance families -- such as m5, m6, r5 and t3 -- and various sizes. The wide range of options makes it challenging to find the optimal EC2 instance for a particular workload.
Compute Optimizer analyzes metrics related to CPU, network and disk utilization, as well as memory which requires you to install the CloudWatch Agent in the EC2 instance. The service identifies under-provisioned or over-provisioned EC2 instances based on these metrics. It also flags instances that are considered optimized and displays options for different EC2 instance types as well as the differences in price, performance, migration risks, vCPUs, memory, storage and network.
For example, Figure 2 shows options calculated for a t2.nano EC2 instance.
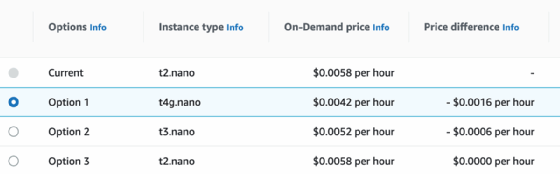
The service will display expected CPU and memory utilization metrics for each selected option and calculate a forecast against current metrics. In most cases, AWS Graviton-based instances are also displayed as an option. Similar recommendations for EC2 Auto Scaling Groups are configured in the account.
EBS volumes
EBS offers four volume types. These volume types differ in performance characteristics and price, allowing you to tailor your storage performance and cost to the needs of your applications:
- Provisioned IOPS SSD (io1 and io2). Backed by solid-state drives (SSDs), this provides high performance and is best suited for latency-sensitive transactional workloads
- General Purpose SSD (gp2 and gp3). Backed by SSDs, this provides high performance and works well with a broad range of transactional workloads best suited for latency-sensitive transactional workloads, dev/test environments and more.
- Optimized HDD (st1). Backed by hard disk drives (HDDs), this is best for throughput-intensive workloads that you access frequently.
- Cold HDD (sc1). Backed by HDDs, this is ideal for less frequently accessed workloads.
Choosing the right EBS volume will depend on each application's specific requirements for data storage, throughput, availability and operations per second. Cost for an EBS volume can easily vary by two to three times depending on the chosen volume type and provisioned capacity. The wrong option can result in overspending.
The service analyzes the following metrics:
- Provides information on the read operations during a selected period.
- Provides information on the write operations during a selected period.
- The amount of read operations during a selected period.
- The amount of write operations during a selected period.
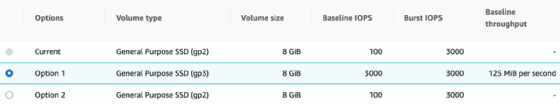
However, it doesn't analyze the used storage amount in each volume, referred to as the disk_used_percent which is a metric published by the CloudWatch agent. Figure 3 shows options calculated for a gp2 EBS volume. Each option also calculates the expected monthly price.
Lambda functions
The main variables to configure when you deploy Lambda functions are Lambda architecture (x86 or Arm), memory, ephemeral storage and provisioned concurrency. These variables affect performance, availability and cost.
Find a balance between memory allocation, execution time and cost, which will vary depending on your application's requirements. In some cases, higher memory reduces execution time to a point where cost gets compensated or even reduced. There are many cases, though, where too much provisioned memory can result in unnecessary spending and no significant benefit in performance.
Compute Optimizer analyzes the following Lambda metrics:
- The amount of traffic.
- Time taken per invocation.
- Errors from function.
- Rejected requests.
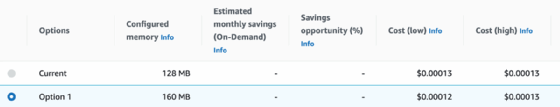
It calculates the price for each recommendation. The list of recommendations displayed in the console includes a range of memory configurations and their respective costs. At the time of publication, the service does not provide analysis for provisioned concurrency. This is a setting that avoids Lambda cold start delays. Figure 4 displays an example of the recommendations found for a Lambda function.
The service also supports the export of findings as text files into Amazon S3 for further analysis. This is useful in large accounts or organizations to create custom reports as well as when you require a more detailed analysis of findings. AWS Cost Explorer resource rightsizing recommendations are also powered by the same engine as AWS Compute Optimizer.


