
Getty Images/iStockphoto
How to create a CloudWatch alarm for an EC2 instance
CloudWatch alarms are the building blocks of monitoring and response tools in AWS. Get familiar with them by creating an Amazon CloudWatch alarm for an EC2 instance.

Let's say your team has created a popular new app. A bug in the code, however, prevents finished sessions from closing and they continue to consume CPU resources. All those wasted resources could eventually prevent users from starting new sessions.
While the bug itself can be easy to fix, the problem of CPU utilization can be solved with a notification system.
In AWS, this task can be handled with a CloudWatch alarm. When set to monitor a specific metric, CloudWatch notifies you if that metric goes above a certain threshold. Let's look at what the different CloudWatch alarms do, when to use them and how to set one up on an EC2 instance.
Types of alarms
For a smaller infrastructure, CloudWatch alarms are a great way to let administrators know if a specific component needs attention. In a large infrastructure, especially where EC2 instances are created and destroyed automatically and frequently, finding problems will be difficult. That's why AWS offers standard CloudWatch alarms and composite alarms.
Composite alarms alert you only if one or more CloudWatch alarms are triggered. You can set separate alarms for each region or availability zone. These alarms act only if errors are found on several different instances at once instead of each individual instance.
Before setting up a new CloudWatch alarm in your AWS account, you'll need two things:
- EC2 instance. You can set CloudWatch alarms on any number of AWS resources, but this article focuses on EC2 running Ubuntu Linux. You can connect to the instance via SSH and change factors that might trip an alarm.
- Simple Notification Service topic. Integrate a SNS topic with a third-party tool to alert your on-call team or to send yourself an email when the alarm is triggered.
How to set up a CloudWatch alarm
Here are the steps to create an alarm.
Step 1. Navigate to the CloudWatch page in the AWS console.
Step 2. On the panel on the left, navigate to Alarms > All Alarms.
Step 3. In the top right corner of the page, click Create Alarm.
Step 4. Choose the metric you want the alarm to monitor from your deployed resources by clicking Select metric.
Step 5. Navigate to EC2 > Per-Instance Metrics.
Step 6. Navigate to the instance you want to monitor.
Step 7. Select the metric name "CPU Utilization" that corresponds with that instance.
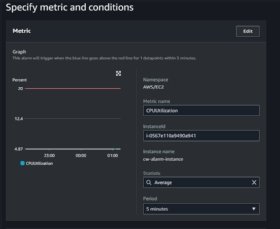
Step 8. Click Select Metric go to a page showing a graph of that metric for the last few hours, and the conditions to trigger an alarm. Values for this metric fall between 0% and 100% CPU utilization.
Step 9. Click Next and specify the action to take once that threshold is reached.
Step 10. Select In Alarm to have the alarm trigger when the CPU threshold is reached.
Step 11. Find Send a notification to the following SNS topic and select the SNS topic created earlier. You can add other actions to take or remove the SNS action. Then click Next.
Step 12. Name your alarm, and then write and save a description of it. At first, your alarm shows the status as Insufficient Data. That's expected; by default, it only polls your instance metrics every 5 minutes, but you can choose as often as 10 seconds. If you didn't change the polling time when you set up the alarm, grab yourself a coffee and by the time you get back, the status should read OK.
How to test the alarm
You can also test your alarm by simulating a spike in CPU utilization using the following steps:
Step 1. Install a the stress-ng tool to overwhelm the CPU.
Step 2. Connect to the instance with SSH and run sudo apt update and sudo apt install -y stress to update the apt repository on Ubuntu.
Step 3. Install the stress command line tool; you can confirm this by running stress –version.
Step 4. After stress is installed, you can run sudo stress --cpu 2 --timeout 1h. This will use two of your CPU cores at 100% for one hour.
Step 5. Open another terminal on that instance and use htop, a cross-platform interactive process viewer, to see the current state of the CPU and system memory. With stress running, the alarm will show the CPU utilization increasing each time the instance is polled until stress is shut down.