
Luiz - Fotolia
Use CloudWatch Container Insights to troubleshoot ECS, EKS
Ensure container-based apps run properly in AWS with CloudWatch Container Insights. Discover how to set up and use this feature for detailed assessments of ECS or EKS workloads.

More and more developers run Docker-based applications in the cloud, and Amazon's container services simplify the launch and management of those applications on AWS. However, the offerings do have drawbacks when it comes to the limited set of available CloudWatch metrics.
For example, Amazon Elastic Container Service (ECS) publishes metrics at the cluster level, such as CPU and memory utilization and reservation, as well as similar metrics at the service level. While this information can help determine the overall health of ECS infrastructure, it's not sufficient to effectively prevent and remediate all AWS container issues.
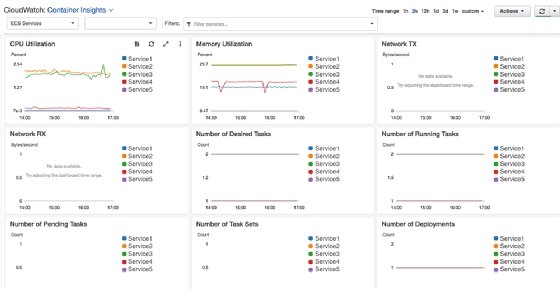
CloudWatch Container Insights, a feature within AWS' native monitoring and management service, provides a more detailed set of metrics at the cluster, service and task level compared to default ECS metrics. Developers can use Container Insights to monitor the number of desired, pending or running tasks for a particular service. This monitoring capability can detect issues related to launching tasks -- when tasks are stuck in pending state and cannot be launched, or when a task is launched too frequently, which could be a sign of an unhealthy container.
Developers can also use Container Insights to monitor CPU and memory utilization at the ECS task level, which offers a more granular view of system health. CloudWatch Container Insights can examine received and transmitted bytes at the cluster, service and task definition level, which can help developers discover and troubleshoot issues in a way that isn't possible with default ECS metrics.
When it comes to Amazon Elastic Kubernetes Service (EKS) clusters, CloudWatch Container Insights is particularly useful, since EKS doesn't automatically publish metrics to CloudWatch. Here, Container Insights provides visibility at the cluster, node and pod level. Users can access metrics that capture the total number of worker nodes in the cluster and the total percentage of CPU units used on cluster nodes, among others. With these metrics, users can closely monitor the overall Kubernetes infrastructure health and react to potential issues.
Developers can trigger AWS Auto Scaling actions based on resource utilization at the node level and set alarms for when pods are unhealthy. They can also better troubleshoot their AWS container infrastructure by visualizing detailed metrics in a CloudWatch dashboard. These metrics can also be enabled in self-managed Kubernetes clusters running on EC2 instances.
Set up CloudWatch Container Insights
CloudWatch Container Insights isn't enabled by default, so developers have to explicitly configure it. The setup process is relatively simple for ECS clusters and can be completed with one step using either the ECS console for new clusters or the AWS Command Line Interface (CLI) for existing clusters.
For EKS or self-managed Kubernetes clusters, the process isn't as simple, as it requires users to install the CloudWatch agent as well as data collector FluentD. Users will have to configure Identity and Access Management permissions, download custom files, use the kubectl CLI and undertake a few other steps.
For the time being, developers can't enable the feature using CloudFormation for either ECS or EKS, which is a limitation that AWS could improve in the future.
How to access and use CloudWatch Container Insights metrics
CloudWatch automatically builds a detailed dashboard with Container Insights metrics. Enable and view the dashboard in the CloudWatch console, or access Container Insights metrics using the CloudWatch API or CLI, as Container Insights metrics are published as custom CloudWatch metrics. You can also use these metrics to trigger CloudWatch alarms and add them to custom CloudWatch Dashboards.
CloudWatch Container Insights also creates entries in CloudWatch Logs, which enables users to submit their own container-related queries using CloudWatch Logs Insights. This supports more detailed analysis of log entries and deeper visibility into individual metric events, which is useful during troubleshooting activities.
CloudWatch Container Insights pricing
As previously stated, Container Insights publishes metric data as custom CloudWatch metrics, which start at $0.30 per metric, at time of publication. That rate decreases after an account's first 10,000 metrics. A single ECS cluster with one service deployed in it and one task running in the service would publish 16 custom metrics. This would cost $4.80 per month in the U.S. East-1 region, assuming your account hasn't passed 10,000 custom metrics yet. For a single EKS cluster with one namespace, node and pod, there would be 25 custom metrics published to CloudWatch, resulting in a charge of $7.50 per month.
There's also some associated cost to ingest and store data in CloudWatch Logs -- $0.50 per gigabyte ingested and $0.03 per gigabyte per month of data stored. In most situations, CloudWatch Logs costs will likely be low, given the volume of data users send to it.