
Getty Images/iStockphoto
How to create EC2 custom metrics with Amazon CloudWatch
Amazon CloudWatch provides useful monitoring information with its built-in capabilities, but for additional data, it might be time to consider custom metrics.

When you want to monitor the performance and reliability of an EC2 instance in AWS, Amazon CloudWatch probably comes to mind first. This built-in AWS monitoring and observability service helps IT teams to track performance and collect data from many AWS cloud services and resources. For EC2 instances, CloudWatch provides typical monitoring of CPU utilization, hard disk utilization, network input and network output.
But what if you want to take monitoring a step further? That's where EC2 custom metrics come into play.
Why create custom metrics in CloudWatch?
CloudWatch is an effective cloud application monitoring tool, but the built-in monitoring can't do everything. For example, it doesn't monitor traffic on port 80 or port 443. It also doesn't monitor to see if your Nginx server is running as expected.
A custom metric enables you to monitor a specific application binary or runtime. CloudWatch helps you monitor the infrastructure portion of an EC2 instance, such as CPU, hard disk and network. However, if the application running on the instance is down or in a warning state, the standard CloudWatch monitoring won't provide much information.
When CloudWatch doesn't have a metric for your specific use case, you'll want to implement a custom metric.
Let's see what it takes to create a custom metric in CloudWatch. In the following step-by-step tutorial, we review the steps to instruct CloudWatch to monitor a web server running on a Linux EC2 instance to confirm port 443 is open for inbound HTTPS traffic. Before you begin, ensure that you have an EC2 instance running Linux with a Role association for access to CloudWatch. You also need EC2 SSH access to the instance.
Creating a custom metric
To create a custom metric in CloudWatch, you use either AWS Management Console or a script. IT teams should try to automate as much as possible in any environment, and a script is a great method for automation. The automation script in this example is native to Linux and presented in Bash, but you can use any programming language for this purpose.
Create the automation script. To get started, SSH into the EC2 instance. Create a new file called https.sh for the automation code. Open the https.sh file with Vim or Nano, and copy/paste the following code:
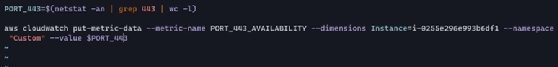
PORT_443=$(netstat -an | grep 443 | wc -l)
aws cloudwatch put-metric-data --metric-name PORT_443_AVAILABILITY --dimensions Instance=i-0255e296e993b6df1 --namespace "port443" --value $
The automation code creates a variable that utilizes the netstat command to grep for port 443 to ensure that it's running. Use AWS Command Line interface with the cloudwatch command to create the custom metric using the put-metric-data option. The put-metric-data option contains four parameters: the metric name, the instance ID that you wish to monitor, the namespace and the value for the metric, which is the variable grepping for port 443.
The last step is to give the proper permissions for the system to run the script. Use the following chmod command:
chmod +x https.sh
Create the cron job. Once the https.sh script is saved, it's time to run it. Ensure that the script runs continuously so that the custom metrics are always updated in the CloudWatch console.
To create a cron job, run the following command on the EC2 instance:
crontab -e
The cron job will open, and you're now ready to set up the cron. To ensure the CloudWatch custom metric pulls the data from the EC2 instance in a reasonable fashion, set the cron job to run the script continuously.
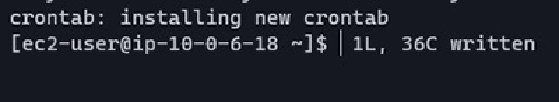
*/1 * * * * /home/ec2-user/https.sh
Once you save the cron job, you'll see an output from the terminal that says the cron is running.
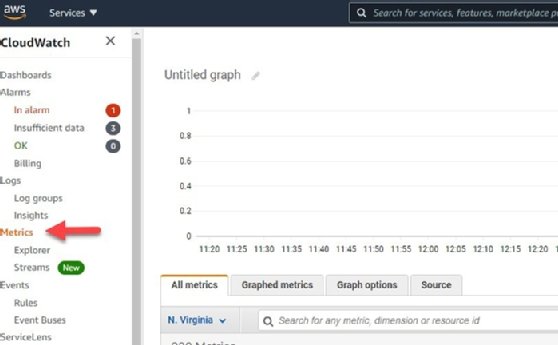
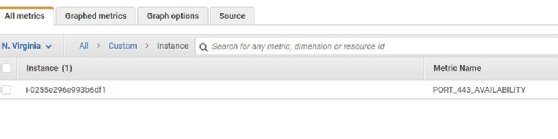
Check the custom metric in CloudWatch. For the last step, open AWS Management Console, and go to the CloudWatch service to check the metric. Under the CloudWatch service, click Metrics.
Under All metrics, there is a new section for Custom metrics.
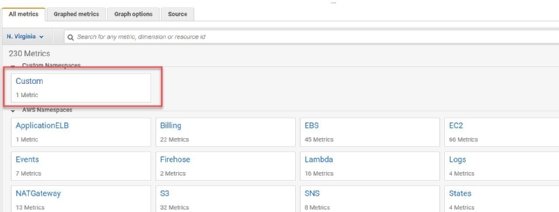
Click on Custom, and the new custom metric is now available.
Custom metrics with other cloud providers
There are many options to make custom metrics for those who use another cloud provider or third-party service.
In Google Cloud Platform (GCP), for example, you can create custom metrics with the OpenCensus service, which is a set of libraries for multiple programming languages that enable you to collect app metrics. You can also use the GCP Cloud Monitoring API to create custom metrics, which works with C#, Go, Java, Node.js, PHP, Python and Ruby.
There are numerous monitoring tools available for Azure cloud users as well. Microsoft put custom metrics in preview mode in 2021 for Azure Monitor. The preview version enables you to send metrics to Azure in several ways:
- Azure Application Insights SDK;
- Azure Monitor agent on Linux or Windows VMs;
- Windows Azure Diagnostics extension;
- InfluxData Telegraf agent; and
- custom metrics via the Azure Monitor API.