
Getty Images
Key Amazon EKS monitoring best practices
Learn how to monitor Amazon EKS resources through tools such as CloudWatch and Prometheus, as well as worker node and infrastructure monitoring tips to maintain application efficiency.

Whether you run Kubernetes services and applications on premises or in the cloud, you must monitor your resources. Just because an application, a service or an infrastructure runs in a cloud-based Kubernetes cluster, that doesn't mean it'll always stay up and perform the way you expect -- especially when it comes to applications and latency.
Let's look at the types of monitoring in Elastic Kubernetes Service (EKS), such as infrastructure and worker node monitoring, and how to determine which tool to choose based on your environment.
Key EKS components to monitor
The components of an application running via Kubernetes on premises in a raw Kubernetes cluster versus in a cloud service, such as EKS, do not change from a working perspective. The major change is where those components run.
EKS has a few primary components that are monitored such as:
- high availability across multiple zones;
- Pods, Deployments, Services and other Kubernetes deployment types;
- AWS metrics and services that EKS relies on;
- cluster state information for the Kubernetes API;
- EBS volumes that the worker nodes are using to store Kubernetes resources; and
- resource metrics in the EC2 instances or AWS Fargate profiles that are running the worker nodes.
This list goes beyond simply managing some servers running Kubernetes. It goes into the actual application and the other AWS services it requires to ensure the application runs and is reachable.
EKS infrastructure monitoring
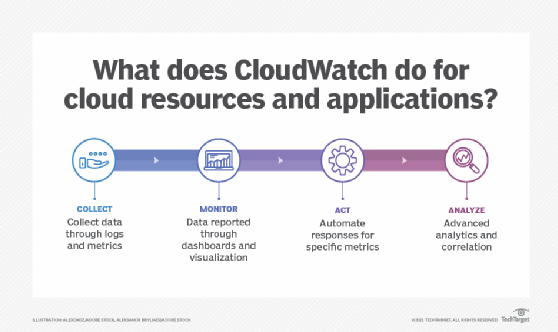
Although there are many components to monitor for Kubernetes, the best place to start is monitoring the EKS service itself. It is comprised of EC2 instances and other AWS services. In a standard setup, most EKS environments use AWS CloudWatch as its built-in monitoring tool. The control plane sends log information and other diagnostics directly to CloudWatch.
Below is a list and description of what to monitor:
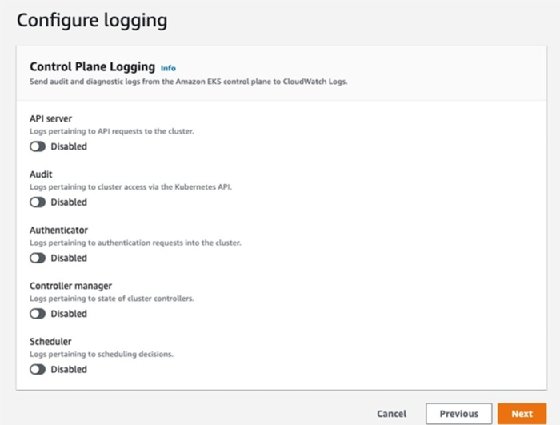
- Controller Manager. Manages core control loops that are inside of Kubernetes by default.
- Scheduler. Manages when and where to run pods in your cluster. Uses labels to control where pods run.
- Audit log. Provides a record of the users, admins and system components that impact a cluster both negatively and positively.
- Kubernetes API log. A cluster's API server is the control plane component that exposes the Kubernetes API. It's the component that does all the work and tells the other aspects of Kubernetes what to do. The worker node then does the heavy lifting.
- Authenticator. Authenticator logs are an EKS-only component. The logs represent the control plane component that Amazon EKS uses for Kubernetes role-based access control authentication using IAM credentials.
When you set up an EKS cluster, you can configure the options as in Figure 1.
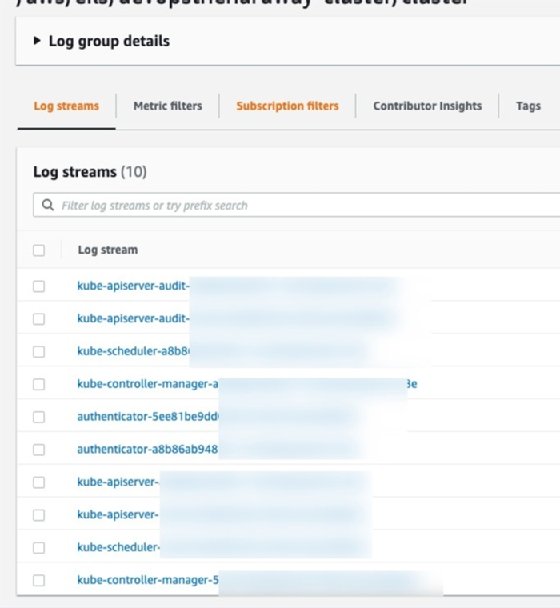
Once the EKS cluster starts to accept requests, you'll see the CloudWatch logs, as in Figure 2, via the clusters log group begin to come in.
Worker node monitoring
When thinking about what to monitor on the EKS worker nodes, consider infrastructure components such as:
- EC2 instances that run as worker nodes;
- EBS volumes; and
- inbound/outbound network connectivity.
The more important components to monitor, however, are at the application level, including:
- kubelet logs;
- pod logs;
- deployment logs;
- service logs; and
- application-specific components.
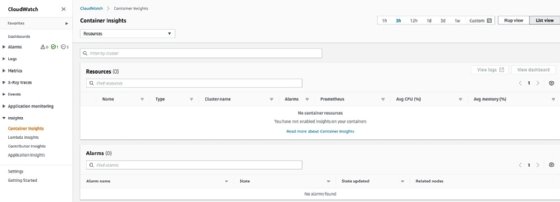
Most choose application performance monitoring because it is more application specific. However, if you use CloudWatch, you can take advantage of its Container Insights to visualize what happens in your containerized environments via UI and dashboard -- as seen in Figure 3. With it, you can implement pod-level metrics with a CloudWatch agent, Fluent Bit or Fluentd. The agent then captures all the logs and sends them to CloudWatch.
Monitoring tools for EKS
There are several monitoring tools available. From an EKS perspective, CloudWatch and Prometheus are the most common. To determine which to choose, consider these two questions:
- How much time do you want to spend setting up monitoring?
- Are you monitoring resources outside of AWS?
CloudWatch
If you're using AWS and you have no resources elsewhere, it may be worth choosing CloudWatch. CloudWatch is like any other monitoring tool, except it's built into AWS. If you're strictly in AWS and expect to remain there, CloudWatch is the best choice because it is built in, straightforward to set up and most of the metrics are accessible without any extra work on your part.
Prometheus
Prometheus, combined with a Grafana dashboard, is a popular option because it can be used across any cloud and most environments, including ones on premises. It is an open source, highly customizable platform that is free to use -- you pay only for where you host it. Keep in mind that it may take time to get all the metrics right since it is not an out-of-the-box product.
Prometheus is a good choice if, for example, you have a multi-cloud environment that uses AWS and Azure. It is also preferable with a hybrid cloud environment, such as AWS and VMware ESXi. It's open source nature means you don't need multiple monitoring tools; you can monitor any cloud and on-premises environment.