Automated root cause analysis moves into the mainstream
DevOps monitoring tools that offer automated root cause analysis are now in production within mainstream enterprises. When it comes to their ease of use, however, there is still room to improve.
Automated root cause analysis tools were once the subject of much industry hype. But that hype has given way to real tools that have made their way into mainstream enterprise IT shops.
Since 2017, vendors have trumpeted their DevOps monitoring tools that streamline troubleshooting and even prevent incidents before they happen. It has taken most of 2018 for enterprises to roll such tools out in production. Now, IT ops pros say they have begun to reap benefits from AI, machine learning and analytics features in products from vendors such as New Relic, Logz.io and Splunk.
"At first, the AI capabilities were just a bonus for us," said Cola Calintaru, enterprise architect at Cetera Financial Group, a financial services advisory company in Los Angeles. Calintaru bought a log analytics tool from Logz.io in 2017 for fairly basic log aggregation, as the company's move to distributed systems based on Docker containers orchestrated with Rancher's Kubernetes distribution made manual log management impractical. However, it has explored Logz.io's more sophisticated automated root cause analysis features in 2018.
"We had an issue with Postgres [databases] in production, related to a misconfiguration in one service that could have been tricky to find," Calintaru said. "Logz.io alerted us to the issue and pinpointed the cause quickly, which let us dive right in to fix it."
Cetera uses Logz.io alongside New Relic's suite of business intelligence and IT infrastructure monitoring tools. New Relic delivers infrastructure metrics alongside Logz.io's system logs, and helps business managers assess the overall health of the company. In September 2018, New Relic updated AI-powered features for its IT monitoring software and New Relic Query Language, such as outlier detection and alerts, as well as incident context to speed IT incident response.
Cetera hasn't fully explored New Relic's latest automated root cause analysis features, but Calintaru said New Relic helps his engineering teams assess the overall health of the IT environment and identify the general areas they should look to during incident response. Once they spot these areas, the teams use Logz.io to drill into finer details about each system under scrutiny.
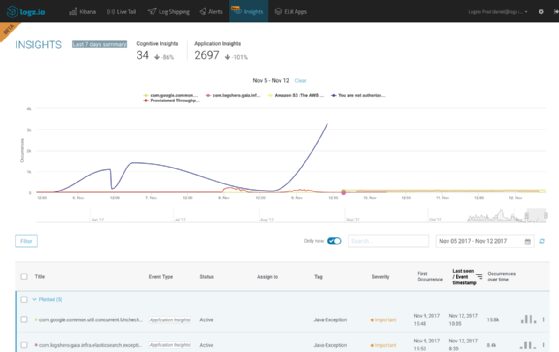
Logz.io's Application Insights tool offers automated root cause analysis based on log data.
Automated root cause analysis roadmap includes accessibility push
Splunk, which is another log aggregation and IT monitoring tool vendor, updated its automated root cause analysis features with version 4.0 of its IT Service Intelligence (ITSI) software this week. Version 4.0 adds more granular automated root cause analysis for IT services; the previous version calculated an overall service health score with predictions about whether the score would rise or fall.
The 4.0 release adds predictive analytics features, such as anomaly detection, predictive error clustering and data-driven remediation recommendations, to individual key performance indicators (KPIs) in ITSI.
"The main problem with ITSI is that it took a lot of experience to set up machine learning features," said Steve Koelpin, lead Splunk engineer for a Fortune 1000 company in the Midwest.
Before his current job, Koelpin worked for a Splunk partner as a professional services consultant. He has a personal educational background in mathematics and statistics. Without that background, Koelpin said it would have been difficult to implement predictive analytics. ITSI 4.0 is more geared toward people that lack that level of experience.
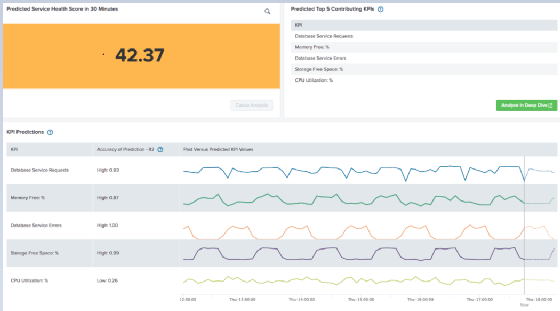
Splunk's ITSI 4.0 includes more granular predictive analytics about key performance indicators.
ITSI revamped user dashboards and is now easier to set up, point toward an IT service, and reap results, Koelpin said. Predictive thresholds for KPIs out of the box will also help inexperienced users get more actionable information from the tool -- Koelpin had to set up this more granular analysis himself in the previous version of ITSI with help from a Splunk data scientist and the Splunk Machine Learning Toolkit, a free app.
We found a way using the Splunk Search Processing Language to backfill service health scores, but we'd like that feature to be baked into the product.
Steve Koelpinlead Splunk engineer, Fortune 1000 company
Koelpin, a member of Splunk's user advisory council, said there's one item still outstanding on his wish list for the automated root cause analysis tool: a way to more quickly glean insights on KPIs and services as they're added. ITSI can get some actionable insights on application health right away, but Splunk documentation recommends models be trained for 30 days for best results.
"If you modify or add a KPI or service now, you typically have to wait 30 days to train the analytics model," Koelpin said. "We found a way using the Splunk Search Processing Language to backfill service health scores, but we'd like that feature to be baked into the product."
Splunk confirmed that the ability to backfill service health scores currently requires additional customization through SPL, but the company said it will consider its addition to ITSI as a short-term roadmap item.
Dig Deeper on Systems automation and orchestration