
What is a key performance indicator (KPI)? Strategy and guide
What are KPIs in business?
Key performance indicators (KPIs) are quantifiable business metrics that corporate executives, managers and other stakeholders use to track and analyze factors deemed crucial to meeting the organization's stated objectives. Effective KPIs focus on the level of achievement most important for progressing toward strategic goals and performance targets.
From a functional standpoint, KPIs encompass a wide variety of financial, marketing, sales, customer service, manufacturing and supply chain metrics. KPIs can also be used to track performance metrics related to internal processes and departments, such as human resources and IT operations. Regardless of the type, however, the purpose of any KPI is to show how well an organization is doing in achieving a stated goal.
How do organizations use key performance indicators?
KPIs differ from organization to organization depending on the business's priorities. For example, a public company might use a KPI to monitor its stock prices throughout the year, while a privately held startup might use a KPI to track the number of new customers added each quarter. Often, even companies in the same industry monitor different KPIs tailored to their individual business strategies and management philosophies.
The use of KPIs can also vary within an organization, where stakeholders will monitor different KPIs depending on their roles. For example, a CEO might track a KPI on profitability, while the vice president of sales focuses on a KPI that measures the ratio of sales wins versus losses. At the same time, different business units and departments often monitor their own KPIs.
Most organizations use a mix of KPIs, some at the organization level, others within specific departments, groups or teams. Project managers might use KPIs to track performance in their individual projects. In addition, individuals within an organization might use their own KPIs, setting their own goals and then monitoring the KPIs to track progress toward meeting those goals.
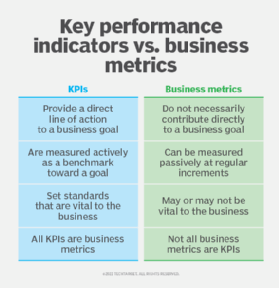
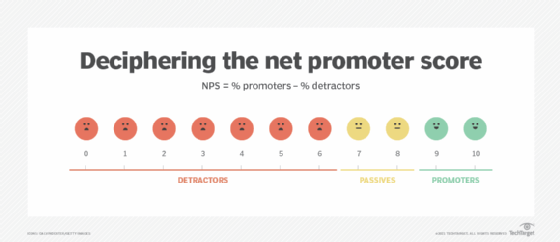
Key performance indicators are sometimes thought to be the same as metrics, but they have slightly different meanings. Although they're both concerned with tracking performance, metrics are simply measurements of everyday operations or processes, such as the number of website visitors or items sold. In contrast, KPIs are tied to specific performance goals at various levels within the organization and how well those goals are being met. For example, Net Promotor Score (see image below) is a KPI that measures the loyalty customers have toward product, service or brand. It indicates how well a company is performing in this regard and can help the business determine best course of action to engender a more loyal customer base.
Why are KPIs important?
KPIs can help an organization track how effectively it is meeting its performance goals. The right KPIs can benefit the organization in multiple ways, leading to its organizational health and success:
- KPIs focus on how well a business is doing. Without them, it can be difficult for stakeholders to evaluate performance in a meaningful way and then make operational changes to address potential issues.
- KPIs help to keep everyone in the organization focused on business initiatives and tasks that are central to its success. Without these KPIs, it becomes more difficult to communicate and reinforce business priorities.
- KPIs can highlight business successes or issues based on measurements of current and historical performance. They can also point to future outcomes, giving executives early warnings of possible business problems or advance guidance on potential opportunities. Armed with such information, business leaders can manage operations more proactively, with the potential to gain competitive advantages over rivals.
What are the 4 main types of performance indicators?
KPIs can be classified in many ways. The following categories represent four of the most common classifications:
- Lagging indicators. This type of KPI measures the results of business activities, such as quarterly sales or revenue growth. They're referred to as lagging indicators because they track events that have already occurred.
- Leading indicators. These KPIs herald upcoming business developments, such as sales bookings that will generate revenue in future fiscal quarters or years. They can help predict trends, outcomes and future successes.
- Quantitative indicators. These KPIs are based on numerical measures, such as revenue or website traffic. They're easy to assess and compare over time and are frequently used to monitor progress toward specified numerical targets. Quantitative indicators provide accurate, data-based insights into how well an organization is performing.
- Qualitative indicators. These indicators are more abstract and open to interpretation, such as how well users experience a product or website. Identifying useful qualitative indicators can be challenging, and the organization might need to take extra steps to come up with appropriate measures. For example, a marketing team might use an online survey that asks customers to rate the company's products and then create a KPI based on the results.
KPIs can be categorized in other ways, too. For example, a KPI might be classified as either strategic or operational. Strategic KPIs operate at an upper, organization-wide level, providing executives with the big picture they need to track how well the organization is meeting its long-term objectives. Operational KPIs tend to focus on more immediate concerns, working in tighter time frames with limited scopes.
Developing key performance indicators
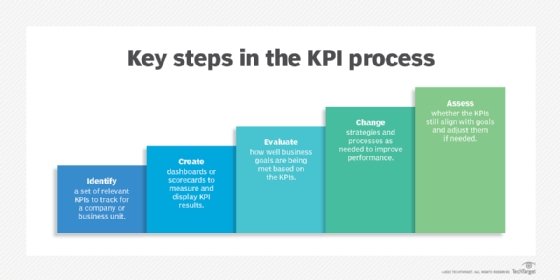
The exact process used to develop KPIs can vary from organization to organization, but it generally includes the following steps:
- Establish strategic goals. Determine the goals for the organization, department or other entity that requires the KPIs. Ensure that the goals are consistent with the organization's overall objectives.
- Select the appropriate measures. Identify business measures that are specific to the goals and that can clearly indicate whether the goals are being met and will reflect a measure of success for the organization or other entity.
- Set up the infrastructure. Ensure that infrastructure is in place for collecting the data needed to support the selected measures and for carrying out the necessary extract, transform and load operations. Also establish a system for presenting the KPIs to the stakeholders, such as setting up a dashboard or implementing a reporting structure. Many organizations implement a business intelligence (BI) platform to support their KPI, visualization and reporting initiatives.
- Define the KPIs. Create KPIs that reflect the goals and measures defined in the previous steps, using the data collected through the BI infrastructure. Decide which KPIs are most appropriate for achieving each desired outcome, but don't go overboard on the number of KPIs. Fewer often is better.
- Publish the KPIs. Share the KPIs with stakeholders, either through a dashboard or via reports (or both). Ensure that the data is updated according to expectations and that the KPIs and infrastructure are properly maintained.
Organizations should invest the time and effort necessary to develop the right KPIs for their situations. When defining their KPIs, many organizations follow the SMART approach:
- Specific. A KPI needs to be very precise about which goal needs to be achieved and how it will be measured.
- Measurable. The KPI must be based on a goal that can be effectively measured so stakeholders will be able to clearly see how successfully the goal is being met.
- Achievable. The KPI's goal should be both realistic and achievable.
- Relevant. The KPI should be relevant to the organization's larger business objectives.
- Time-bound. The time-bound KPI should be specific to a realistic time frame to help stakeholders stay focused and on track.
Organizations should also aim for a balance between leading and lagging indicators to ensure that the most important elements are being measured. Lagging indicators make it easier to comprehend results over time, such as sales over the past 30 days. Leading indicators enable organizations to make changes to their strategy to achieve better and attainable results.
How to improve an existing KPI strategy
When KPIs don't deliver or reflect the expected outcomes, organizations might need to adjust their KPI strategies. To help with this process, they should consider the following three guidelines:
- Evaluate and update the KPIs. Organizations should update their KPIs in response to market, customer or organizational changes. To this end, they should regularly review their KPIs and adjust them accordingly to ensure that they're still accurate, timely and relevant. Stakeholders should be kept abreast of any changes made to the KPIs.
- Evaluate the data sources. IT and the data teams should review the data sources and ETL operations that support the current KPIs to ensure that the systems are functioning properly and that the data is still accurate and being properly managed.
- Contact key organizational stakeholders for feedback. To learn more about the KPIs being used and potential areas for improvement, KPI developers should contact key stakeholders within the organization for their feedback and suggestions.
Best practices for implementing KPIs
When implementing KPIs, management should provide information about them to everyone in the organization who needs to understand how they work, which business metrics matter the most and why, and what constitutes successful performance. This effort could include the entire workforce for broad corporate KPIs or smaller groups of workers for KPIs that apply to their particular departments, projects or other initiatives or functional areas.
In addition to effective communications, management should consider a number of other best practices when implementing KPIs:
- Choose the right tools for deploying KPIs. Many organizations already use BI platforms, business analytics solutions or reporting tools that include KPI support. The tools typically collect relevant data from operational systems and create dashboards or reports that contain the KPIs. If organizations are not already using such a tool, they should consider a solution that can help streamline KPI delivery.
- Present KPIs and visualizations through dashboards. KPIs are often provided to stakeholders via BI dashboards or performance scorecards that also include charts and other data visualizations, where users can drill down into the performance data for further analysis. In some cases, the visualizations are tied directly to relevant KPIs so correlations in the data are easy to understand. Regardless of how the KPIs are presented, they should be readily available and easy to access so stakeholders can get current information they need when they need it.
- Provide a broader view of performance. KPIs should be carefully planned so that together they provide a broader view of business performance beyond simple metrics such as operating income and other common financial measurements found in a profit and loss statement. For example, a dashboard that includes a KPI for monthly online sales might also include a KPI for the number of monthly website visits to show whether there is any correlation.
- Create standard and customized reports. Using standard and customized reports to deliver KPIs can be beneficial when they also include more comprehensive information. While certain KPIs are useful on their own, others might require additional details to clarify the meaning of the data. For example, if the KPI relates to social media engagement, a report could also include details about each social media site that its team uses.
- Limit the number of KPIs. One of the challenges in planning KPIs is deciding how many to track to determine organizational success. Too many KPIs can pull attention away from the truly important ones. KPIs are usually more effective when you limit them to a small set of the most relevant KPIs.
- Continually evaluate KPIs. Managers and other stakeholders should continually evaluate their KPIs to ensure they're still relevant and aligned with business priorities. If individual KPIs no longer serve a useful purpose, they should be refined or replaced.
One of the most important steps that an organization can take is to establish a KPI-driven culture. KPIs are useless if people don't know what they indicate or how to use them. To ensure that everyone is working toward the same strategic goals, management should strive to increase data literacy across the organization. They should also employ best-in-class BI software, train workers and provide them with relevant KPIs to reinforce decision-making that benefits the business.
Examples of key performance indicators
An organization's business strategy and the sector in which it operates influence the KPIs it chooses. In contrast to brick-and-mortar retailers, for example, a cloud-based service provider might concentrate on customer acquisition and churn rather than revenue per square foot or average customer spend.
The following are some examples of industry-specific KPIs.
Financial KPIs
Beyond revenue, expenses and profit, financial organizations commonly use KPIs such as the following:
- Gross and net profit margin, which measure how much money a company makes on sales of products.
- Inventory turnover, which tracks how quickly products held in inventory are sold.
- Cost of goods sold, a measure of the materials and labor costs incurred in making products.
- Accounts receivable turnover, a ratio that quantifies how quickly payments on credit sales are collected from customers.
- Days sales outstanding, a related metric that gauges the number of days' worth of receivables that have yet to be collected.
Thanks to artificial intelligence and machine learning, many finance teams and CFOs are adopting financial business analytics tools more frequently to increase their success with KPIs.
Marketing and sales KPIs
Organizations that focus on marketing and sales often use a wide range of KPIs, including the following:
- Lead conversion rate, which measures the percentage of sales leads successfully turned into customers.
- Customer acquisition cost, which calculates the average cost of acquiring new customers.
- Return on marketing investment, which quantifies the financial payback of marketing campaigns and programs.
- Customer lifetime value, which predicts the total profit a company is likely to make from sales to individual customers.
- Customer churn rate, which measures how many customers stop buying a company's products.
Customer service KPIs
Key performance indicators in customer service call centers include the following:
- First call resolution rate, which tracks the percentage of incoming customer inquiries that are addressed without the need for additional calls.
- Cost per call, which quantifies the average cost of handling a call.
- Call volume, which measures the total number of calls handled during a particular period.
- Hold time, which measures the average time customers spend on hold waiting for representatives to answer calls.
- Abandoned calls, a ratio expressing the number of calls terminated by customers on hold versus. the total number of calls.
- Longer-term, preventative KPIs, such as employee engagement and knowledge base articles, are sometimes included in customer service KPIs.
Manufacturing KPIs
KPIs for manufacturing and supply chain operations include the following:
- The percentage of defective products made by a company.
- Manufacturing cycle time, which measures how long it takes to make products.
- Carrying cost, which puts a value on what it costs to keep products in inventory.
- Percentage of out-of-stock items, which tracks the number of products that aren't available in inventory when customers order them.
- Back-order rate, which is a related metric that quantifies the number of orders that can't be filled when they're placed.
- Return rate, which assesses the percentage of items a customer returns.
Human resources KPIs
Compensation management, labor or workforce management and recruitment are three of the primary concerns of human resource departments. As such, they often track the following key performance indicators:
- Employee satisfaction levels.
- Turnover rates.
- Absenteeism rate.
- Quality of hires.
- Promotion rate.
- Vacancy rates.
IT KPIs
IT managers commonly look at the following KPIs, among others:
- System uptime.
- Compliance with service-level agreements.
- Total help desk support tickets.
- Critical bugs.
- Server downtime.
- On-time project completion rates.
- Average resolution time on help desk tickets.
Industry-specific KPIs are also used in retail, healthcare and other industries. For example, a retailer might track metrics such as the average purchase value of sales transactions, while a healthcare provider might measure emergency room wait times, the average length of stay in a hospital and patient readmission rates.
Adopting the right tools can help businesses achieve customer success. Discover and compare eight popular customer success software platforms. Also, KPIs help companies gauge success. Explore 10 KPI templates for your executive dashboards.