Free DownloadWhat is customer experience management (CEM or CXM)?
Positive customer experiences can boost both a company’s reputation and bottom line, but negative ones can have the opposite effect. Crafting and implementing a customer experience management strategy is essential. This guide explores techniques and tools that can help organizations construct and implement an effective customer experience management plan.
Top 12 customer experience metrics and KPIs in 2026
Net Promoter Score is one of the most widely used CX metrics, but teams should also track CSAT, CES, churn, retention and other KPIs to measure performance.
Providing a positive customer experience is crucial for today's brands, but it can be difficult to determine the success of a CX strategy.
As CX strategies become more data-driven and omnichannel in nature, organizations must ensure their measurements reflect consumer behaviors. Customers interact with companies through mobile apps, messaging platforms, online marketplaces and social media, often within a single purchasing journey. Effective customer experience metrics must account for this complexity and align with evolving business priorities, such as eco-friendly sourcing, emissions tracking and recyclable product packaging.
CX teams should combine different metrics to better understand success and identify areas for improvement. They often struggle to identify which metrics to employ, and when and why to measure them. This task becomes even more complex as organizations factor in nontraditional metrics, such as customer sentiment from social media or behavior tied to environmental and sustainability values. As consumer expectations evolve, so should the KPIs that help brands meet them.
For CX leaders, the challenge is not just collecting more data, but choosing the mix of metrics that best connects customer behavior to retention, revenue and service performance.
CX teams should combine different metrics to better understand success and identify areas for improvement.
The following customer experience metrics are considered some of the most important that a team should monitor and understand.
1. Net Promoter Score
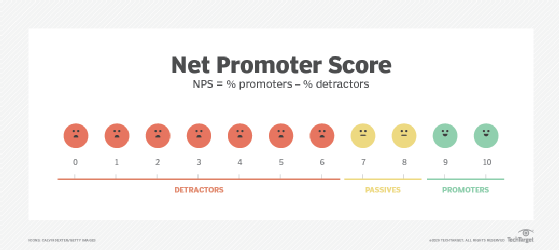
The Net Promoter Score (NPS) is a widely used metric that measures a customer's loyalty to a company. Organizations issue a single-question survey to collect this information, where respondents assign a number value between 0 and 10. This single question measures the customer's perception of the brand: How likely is it that you would recommend [company/product/service] to a friend or colleague?
Detractors (score of 0-6). These unhappy customers could tarnish a brand through word-of-mouth, online through social media or through other means.
Passives (score of 7-8). These customers are generally satisfied, but they're vulnerable to offerings from other competing companies in the industry.
Promoters (score of 9-10). These customers are extremely satisfied and loyal enthusiasts who continue buying from a brand and provide growth opportunities from their referrals.
NPS is calculated by subtracting the percentage of detractors from the percentage of promoters.
Net Promoter Score can help teams measure customer loyalty and compare brand perception over time.
To collect the data, companies can send NPS surveys through different vendors or survey tools, such as those from Qualtrics, SatisMeter and Retently. NPS surveys are most beneficial within 30 days of a new customer acquisition and then every three months.
Organizations might also track NPS through digital channels, such as in-app messaging, email or social media, to identify variations in experience across touchpoints. This level of granularity can highlight weaknesses in an omnichannel strategy and help CX teams gain actionable insights throughout the customer journey.
2. Customer satisfaction
Like NPS, the customer satisfaction (CSAT) score is also calculated with survey data. Where NPS measures how likely a customer would be to refer a peer to a company, the CSAT score rates the experience with a product or service. CX teams can let customers respond in ranges from 1-5 or 1-10. Companies then calculate the average percentage of these survey responses.
The CSAT score pertains to any interaction a customer has with a brand, so it can determine the short-term changes in customer approval before or after different touchpoints. The best times to perform these surveys include leading up to a service, the recent launch of a new product and after services were rendered. Brands can often deploy CSAT surveys more frequently than NPS surveys.
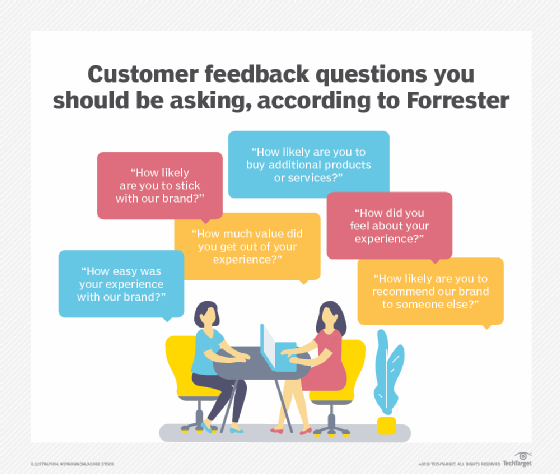
Survey design affects the quality of customer insights, so teams should match questions to the metric they want to measure.
Organizations have also chosen to integrate real-time CSAT feedback into customer service platforms and use AI-based analysis to detect patterns or other insights. This can automatically categorize low scores by issue type or sentiment, which enables faster root cause identification and improves incident response.
3. Customer effort score
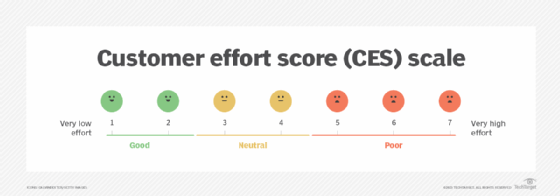
The customer effort score (CES) measures CX regarding the overall effort required to use the product or service. CES can also gauge how likely a customer will continue to pay for that product or service. A seven-point rating scale from "very difficult" to "very easy" gives survey senders the ability to tailor these questions based on many variables. For example, CX teams can ask, "How much effort was it to get a resolution from customer service/support?" or "How much effort did you personally have to put into onboarding or training your team?"
Customer effort score helps teams measure how easy or difficult it is for customers to complete a task or resolve a problem.
Businesses can deploy a CES survey in a few different areas:
Immediately following an interaction with customer service.
Immediately after an interaction with a product or service.
Any time the company wants to measure the aggregate experience someone has with the brand, product or service in general.
Many organizations also use CES in conversational AI workflows, such as chatbots and virtual assistants, to evaluate how intuitive those interfaces are. Measuring customer effort in these support channels can aid in digital CX optimization.
4. First response time
First response time (FRT) is a customer experience metric that measures the elapsed time between a customer's initial inquiry and the moment they receive the first response from a company's customer support team. This metric evaluates the efficiency and effectiveness of a company's customer service operations. FRT reflects the organization's commitment to promptly addressing customer needs and concerns, significantly influencing customer satisfaction and loyalty.
To calculate FRT, a timestamp must be present at the time of the initial submission. The timer begins there and lasts until the initial response from the customer success representative. Organizations must exclude auto-responses from this calculation to accurately represent the initial inquiry and initial response from a live agent, not a chatbot.
Monitoring and improving FRT can enhance customer satisfaction, increase loyalty and create a more positive brand image. Customers expect faster response times on digital channels, especially in messaging apps, where delays longer than 60 seconds can affect satisfaction. This has led many organizations to segment FRT by channel, with distinct benchmarks for each one.
5. Average resolution time
Average resolution time (ART), also known as time to resolution or mean time to resolution, represents the average duration customers spend engaging with a company's customer support, helpdesk or service team until their problem is successfully addressed. This metric also uses timestamps to capture the interactions from the initial inquiry and all touchpoints between the company and the customer.
This metric encompasses the time customers spend waiting for an initial response and additional waiting periods between interactions. The timer stops when the customer's issue or query is resolved and the support interaction concludes, using a timestamp of when the support ticket closes or the customer's interaction ends.
To calculate ART, divide the total time to resolve all requests by the number of requests received over the evaluated period. This metric can help businesses enhance customer satisfaction, reduce customer churn and demonstrate their commitment to providing timely and effective solutions to customers' problems.
Additionally, organizations might choose to embed self-service and generative AI tools into service workflows to lower the average resolution time. When paired with performance analytics, these tools can highlight which tickets are best suited for automation and which require human intervention.
6. Churn rate
Churn rate is a simple calculation that displays the percentage of customers who do not renew or cancel their contracts with a company in a given time. Many companies with a recurring revenue business model care about churn rate because customer acquisition is harder and more costly than retention.
Ideally, brands should constantly measure churn rate, but they should at least calculate it quarterly and annually. Regular measurements help CX teams receive better forecast information for the following periods. If brands can predict customer churn from historical data, they can better plan marketing and retention activities against new initiatives. Churn rate has an easy formula, but businesses must first identify the time period they want to measure against.
Many businesses also measure churn rate alongside product usage analytics, particularly for digital platforms and subscription-based services. High churn might indicate dissatisfaction, but it can also point to broader issues, such as ineffective onboarding, poor UX design or misalignment between product value and customer expectations. Organizations should incorporate behavioral signals, such as drop-off in feature engagement or app usage, to proactively address churn risks.
7. Retention rate
Customer retention rate is the opposite of churn rate. It focuses on customers with a positive brand perception who are likely to stay with a company's service or product. This metric calculates the percentage of customers a company has retained over a given period. Retention rate is also a good predictor of brand loyalty, customer engagement and emotional connection to a brand.
These often-annual evaluations give the business good comparison data against the churn rate and start to paint a better picture of overall turnover.
Customer retention rate = ((number of customers at end of period - number of new customers within that period) / number of customers at start of period) x 100
Retention rate has gained additional strategic importance due to growing investor interest in sustainable, recurring revenue models. In addition to tracking the rate itself, many businesses also calculate segmented retention by customer personas, subscription tier or region to better align marketing and customer success strategies with high-value audiences.
8. Customer lifetime value
Customer lifetime value (CLV) is often at the top of a growing company's list of important metrics. It is the total revenue a business can reasonably expect from a single customer account. The longer someone continues to purchase from a company, the higher their lifetime value.
Throughout the customer journey, the company's support or success teams directly affect CLV, as they help solve problems or offer recommendations that encourage customers to stay loyal. When combined with retention and churn rates, CLV can also forecast growth.
To calculate CLV, take the average purchase value -- for instance, an annual subscription -- and multiply by the average purchase frequency, which is how many years the average customer renews for. Companies can get to the root of their lifetime value by averaging customer lifespan and multiplying it by the average deal size.
Average deal size x Average customer lifespan = CLV
Organizations often use CLV in customer segmentation strategies, and AI-based systems calculate predicted lifetime value in real time. These projections can help tailor messaging, upsell campaigns and create retention programs for high-value customers. Brands with sustainability-aligned offerings also factor in environmental preferences, such as interest in recyclable products or emissions transparency, into segmentation.
9. Visitor intent
When creating a digital experience for customers, companies can't always greet them at the door and ask what brought them there, but that information is still crucial. Understanding why customers engage with a brand and what they seek is important.
There are two types of intent: informational and transactional. Informational intent refers to someone who visits a site or store to learn something, while transactional intent refers to someone who wants to perform a specific action, such as making a purchase or downloading something.
A single-question survey can easily measure visitor intent and should provide multiple answers a user can choose from. A common question might be: "Which of the following best describes the primary purpose of your visit today?"
Visitor intent can eliminate the guessing game a marketing team might perform regarding why someone visits a website. It can also help develop a better picture of the visitor's needs and which channels customers prefer.
Additionally, with evolving compliance regulations, companies lean more heavily on declared data, such as visitor intent, rather than inferred data from third-party tracking. Progressive disclosure techniques, like embedded surveys in chat or navigation flows, can collect intent data without disrupting CX. This approach supports more precise messaging and content targeting in B2B and B2C scenarios alike.
10. Customer referral rate
Customer referral rate (CRR) is a valuable customer experience metric -- specifically, for sales and marketing teams. CRR measures the percentage of customers who refer or recommend a company's products or services to others within a specific period. It reflects customer satisfaction and loyalty and how effectively a company's offerings and customer service inspire customers to become advocates and brand promoters.
To determine a company's CRR, businesses must identify customer referrals to other companies during a specific period and count the total customers. CRR divides those referrals by total customer accounts and then multiplies them by 100 to get the percentage.
A high customer referral rate indicates customers are delighted with the company's offerings and services, leading them to actively promote the brand. Positive word-of-mouth from referrals can significantly affect customer acquisition and brand reputation, making CRR vital for businesses that foster customer loyalty and drive organic growth.
Many organizations use referral metrics alongside NPS and social media sentiment to validate advocacy signals. This approach helps identify high-potential brand champions whom businesses can target for ambassador programs or incentivized campaigns. Additionally, brands that promote sustainable, eco-friendly initiatives find greater referral traction among customers who prioritize sustainability values.
11. Customer emotional intensity
Customer emotional intensity measures the strength of emotional responses customers associate with a brand, product or interaction. Unlike traditional satisfaction or loyalty metrics, which focus on frequency or sentiment, this metric captures how deeply customers feel, both positively and negatively, about their experiences.
Emotional intensity is a strong predictor of behavior. High-intensity experiences, whether frustration during support or delight after a successful onboarding, are more likely to drive customer actions, such as switching providers, writing reviews or sharing on social media channels. Service teams who can identify moments of emotional intensity can prioritize where to intervene, optimize messaging or double down on successful touchpoints.
Organizations can calculate emotional intensity with sentiment analysis tools that assign weighted values to emotional language in interactions across channels, like support tickets, chats or social posts. Some platforms combine linguistic data with behavioral indicators -- for example, repeat page visits, scroll depth or clicks out of a page -- to create an emotional intensity score.
Additionally, call center leaders might choose to add AI-powered emotion detection to call recordings to determine real-time emotional cues. This metric helps organizations respond to what customers say and how strongly they feel about it.
12. Revenue per user
Revenue per user (RPU), sometimes referred to as revenue per account or per customer, measures the average revenue generated from each active customer over a specific period. This metric provides a clear view of each customer's financial value and serves as a crucial link between CX and business outcomes.
RPU is especially important in subscription-based or other digital business models where customer behavior can vary significantly by usage tier or plan. It can help organizations evaluate how CX improvements, such as simplified onboarding, proactive support or product upgrades, affect spending behavior.
RPU = Total revenue during a time period / Number of active users in the same period
More organizations have integrated RPU into customer segmentation models alongside behavioral and psychographic data. CX leaders can use this metric to evaluate which messaging strategies or experience features drive higher revenue from different user groups.
This metric provides a clear view of each customer's financial value and serves as a crucial link between CX and business outcomes.
How to turn metrics into results
Brands that use these customer experience metrics should know how to use the information to create results. Sometimes, there is science behind this -- just as there is science behind collecting the data -- but at the same time, brands must build human-to-human relationships.
CX leaders should put themselves in customers' shoes and think about how the company can improve overall based on the data. For example, a brand that received negative feedback about its onboarding or implementation process should evaluate those pain points. If it receives negative feedback about a return policy, it should consider widespread changes. Even if a company gets positive feedback about a certain customer service representative, it should find out what that employee does to create such loyal customers, then implement those strategies across the department.
CX teams interested in the science behind what to do with these numbers should look at them all together -- alongside what they mean to the business -- and see where the most opportunity for change exists to improve CX.
Positive CX can increase revenue from lower churn rates, referrals, customer retention and lifetime value. Sales and marketing efforts should not end with the close of net new business. Brands should focus similar efforts on the satisfied audience that has already chosen to do business with them.
The most effective CX measurement strategies do not track every possible KPI; they focus on the metrics that best show where experience is improving, where friction remains and where the business is gaining value.
Editor's note:This article was updated in April 2026 to reflect current CX measurement practices and improve the reader experience.
Griffin LaFleur is a MarketingOps and RevOps professional working for Swing Education. Throughout his career, LaFleur has also worked at agencies and independently as a B2B sales and marketing consultant.