
Getty Images/iStockphoto
15 customer success KPIs and metrics to track
What's the best way to tell if customers are satisfied? These customer success KPIs and metrics can gauge everything from potential customer churn to retention.

Many consumers stay with a brand because of the products it offers, but the most successful companies build long-term relationships through effective customer success programs.
With customer success, businesses can retain customers and increase their overall lifetime value. Customer success KPIs and metrics are essential tools to evaluate how well a company meets its customers' needs and expectations. This team plays a significant role in driving customer loyalty, extending beyond the products or services offered.
Organizations can use these metrics to gauge the performance of their customer success teams. By regularly tracking and analyzing these KPIs, they gain a deeper understanding of customer behaviors and preferences. This enables teams to make more informed decisions to refine their products, enhance services and strengthen customer relationships.
What are customer success metrics?
Customer success metrics refer to quantitative and qualitative measures that help organizations understand the effectiveness of how their customer success teams maintain and grow customer relationships. These metrics offer insights into how well businesses support customers, whether through a dedicated customer success manager or scalable support models.
For CX teams, these metrics highlight areas for improvement, inform decision-making and ultimately contribute to creating a seamless and engaging customer journey.
Organizations that focus on customer success metrics can gain the following benefits:
- Improved customer engagement. Metrics give real-time feedback on how customers interact with products and services, helping teams address experience gaps.
- Enhanced support. If businesses track how quickly and effectively CX teams solve customer issues, they can optimize support processes and provide smoother experiences.
- Better customer retention. Understanding the key drivers behind customer loyalty ensures CX teams can take proactive steps to reduce churn and increase customer lifetime value.
1. Customer lifetime value
Customer lifetime value (CLV) is one of the most fundamental metrics customer success teams can measure. It predicts how much the average customer might spend on a company's products or services over the lifetime of the relationship between parties.
With this information, organizations can better understand their ideal customers as well as their value to the company. When CLV increases, the company can determine if its products and services contribute to customer success. Conversely, if CLV decreases, the customer success team should look for flaws in the overall CX.
CLV formula
Average purchase value x Average purchase frequency x Average customer lifetime = CLV
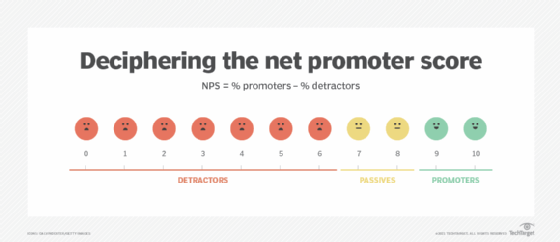
2. Net promoter score
The net promoter score (NPS) sheds light on the customer's feelings toward the brand and its products or services. This measure of customer satisfaction can determine how pleased customers are as they interact with a business. Customers with a higher, or happier, score are more likely to repeat purchases.
This single question survey asks customers: "How likely are you to recommend [Brand/Product/Service] to a friend or family?" To respond, customers use a 1-10 scale of how likely they are to recommend that business or its offerings:
- 0-6: These are detractors or unhappy customers who are most likely to discourage people they know from engaging with that brand, product or service.
- 7-8: These are the passive audience. They are satisfied with their experiences, but not so much that they would give high praise or promotion.
- 9-10: These are the promoters. These customers are the most loyal, enthusiastic about the products or services, and most likely to recommend the brand to others.
3. Customer churn rate
Customer success teams can use a customer churn rate to determine the percentage of customers who no longer use a product or service. Factors that affect churn rate include the following:
- Canceled subscriptions.
- Closed accounts.
- Loss of recurring revenue.
- Loss of recurring business or contract.
Churn rate can measure each individual representative's success in the customer success team. Team members who maintain positive relationships with their contacts are less likely to have high churn or cancellation rates.
Depending on the type of business, customer success teams may struggle to know if or when a customer churns. Often, organizations determine a customer has churned after a certain period with no new purchases. Overall, the metric highlights how many customers ended their relationship. Teams can calculate churn using the following formula.
Customer churn formula
Number of churned customers / number of existing customers = Churn rate percentage
4. Customer effort score
The customer effort score (CES) can show how easily a customer received help from the brand or how much effort they went through to resolve an issue, make a purchase or get an answer to an inquiry.
To calculate this score, customer success teams should send a survey to clients that ask how easy it was to get the help they needed. Like NPS, CES surveys have a single question with a scale from 1-7 -- as seen in the table -- where 1 means customers strongly disagree and 7 means they strongly agree. This metric offers insight for improving customer service, and organizations with higher scores often see happier customers and an increase across several other KPIs.
| 1 | 2 | 3 | 4 | 5 | 6 | 7 |
| Strongly Disagree | Disagree | Somewhat Disagree | Neutral | Somewhat Agree | Agree | Strongly Agree |
CES formula
Number of customers who scored 5,6,7 / Total number of customers who responded = CES
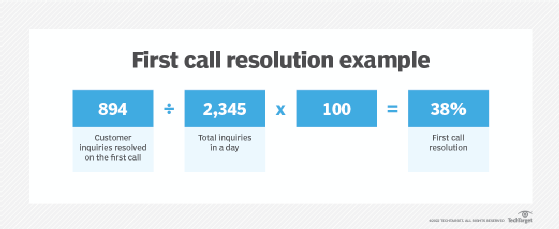
5. First contact resolution rate
After CES, customer success teams should examine the first contact resolution rate for customer service teams. Customers want their problems addressed quickly, and having to wait for customer service or support teams to respond can increase friction between the parties.
The first contact resolution rate is the percentage of customers whose service cases or inquiries were addressed during the first interaction. The higher the percentage, the more indicative of a healthy relationship between company and customer.
6. Customer health score
The customer health score reveals whether a customer sees value in the organization's product or service and if they actively use it. This metric -- primarily used by SaaS companies -- scores customers based on their likelihood to stay and grow with the brand or churn.
These scores vary from company to company. But customer success teams should regularly discuss customers' health, look at other KPIs, potentially send out frequent longform surveys and arrange focus groups. Often, customer success teams don't know which customers need attention. They should understand the indicators to pay attention to, such as how long a customer uses the product for, how many different users engage with it and how many features they use.
7. Customer satisfaction score
Customer satisfaction scores are similar to NPS, but CSAT has one major difference. While NPS asks how likely customers are to recommend the business or product, CSAT only asks them to rate their overall experience with the company. This score helps businesses gauge how customers feel about them after completing an action like a purchase or support resolution.
This score is also set up to measure the customer's immediate reaction to a single experience. It should not be representative of that customer's overall perception of the brand.
CSAT formula
(Number of positive scores / number of total scores) x 100 = CSAT percentage
8. Customer retention rate
Customer success teams can use customer retention rates to determine the percentage of existing customers who remain customers after a period of time. This rate helps teams better understand what keeps customers loyal to the company and could signal where to improve customer service.
This metric is like churn rate, but it focuses on the rate at which a company keeps customers rather than the rate at which they lose them.
Customer retention rate
Number of customers at the end of a period / number of customers at the start of the period = Customer retention rate
9. Average revenue per user
Average revenue per user (ARPU) measures the average revenue generated per customer over a specific period. It helps organizations understand the revenue potential of each customer and gauge the profitability of different customer segments.
Customer success teams use ARPU to track trends in customer spending, which can inform upsell strategies and highlight high-value accounts.
ARPU formula
Total revenue / Number of active users = ARPU
10. Monthly recurring revenue
Most organizations view monthly recurring revenue (MRR) as a KPI of how much the customer base, or their spending, has grown over time. The advent of SaaS companies with monthly service fees, rather than one-time license fees, has made MRR a financial resource to measure cash flow.
MRR shows how much the customer base spends on products or services in each month, which can benefit companies that offer subscription services. Customer success teams can compare this value over time to see growth or shrinkage in MRR.
MRR formula
Number of active customers x Average revenue per user = MRR
11. Renewal rate
The customer base's renewal rate is another financial metric. Many organizations, especially SaaS companies, view this as one of the most important metrics to track.
Many organizations see high activation rates if their product or service is attractive enough to the market. But the true measure of customer satisfaction lies in the renewal rate. A high renewal rate indicates the company or product successfully provided customer success. A low renewal rate likely means customers don't see the success they expected at their initial purchase.
This metric presents opportunities to take advantage of what works, what changes to make or what surveys to deploy to gain more insight on making customers happier.
Renewal rate formula
Number of renewals / Number of users up for renewal = Renewal rate
12. Conversion rate
Conversion rate measures the percentage of prospects or customers who complete a desired action, such as subscribing to a service, upgrading to a premium tier or renewing a contract.
This metric helps customer success teams understand how their efforts at each touchpoint drive meaningful customer behaviors. Tracking conversion rates helps to optimize onboarding, upsells and customer communications.
Conversion rate formula
(Number of conversions / Total number of leads or opportunities) x 100 = Conversion rate
13. Net dollar retention
Net dollar retention (NDR) measures the percentage of recurring revenue retained from existing customers over a period, after accounting for expansions, downgrades and churn. It is a vital indicator of customer satisfaction and growth.
A high NDR suggests that customers stay and increase their spending, through upsells or additional purchases.
NDR formula
(Starting MRR + Expansion MRR - Churned MRR) / Starting MRR = NDR
14. Customer retention cost
Customer retention cost (CRC) calculates the total costs associated with retaining existing customers, including customer support, account management and loyalty programs.
This metric is increasingly important, as businesses aim to balance retention efforts with profitability. An efficient customer success program can reduce CRC while maintaining a high retention rate.
CRC formula
Total retention costs / Number of customers retained = CRC
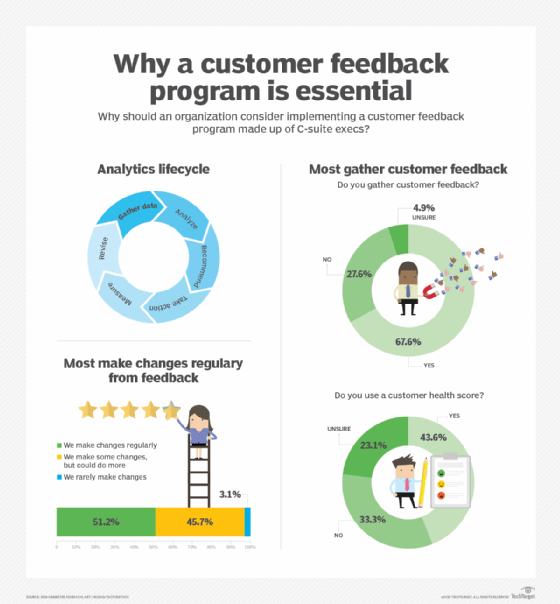
15. Qualitative customer feedback
While many KPIs are quantitative, gathering qualitative customer feedback remains crucial. Insights gathered through surveys, focus groups and direct conversations provide a richer understanding of customer sentiment. Additionally, many customer success teams use analytics and AI tools to analyze qualitative feedback at scale to identify patterns that drive loyalty or dissatisfaction.
Organizations that focus on both qualitative and quantitative metrics can tailor their offerings to meet customer needs, leading to higher satisfaction and longer-lasting relationships.
Editor's note: This article was originally published in 2023 and was updated to reflect changes in customer success best practices.
Griffin LaFleur is a MarketingOps and RevOps professional working for Swing Education. Throughout his career, LaFleur has also worked at agencies and independently as a B2B sales and marketing consultant.