
How to use Microsoft Sentinel with Office 365 to find risks
The security product attempts to ferret out threats that originate from apps and services then assists the enterprise with an automatic response to head off trouble.

As organizations grow and expand the number of services they use, it gets more challenging to keep track of suspicious activities.
Connecting Microsoft Sentinel with the Office 365/Microsoft 365 tenant expands the logging capabilities of the collaboration platform with the added benefit of an automated response system to keep administrators from having to intervene on every alert. Microsoft Sentinel, formerly Azure Sentinel, is a cloud security information and event management combined with a security orchestration, automation, and response features. Microsoft Sentinel collects data from multiple locations -- such as applications, services and hardware -- and ingests user, device, application and infrastructure logs to detect security threats.
What's required to use Microsoft Sentinel?
Microsoft Sentinel operates with Log Analytics in Azure to create or use existing workspaces and store ingested data. Before deploying Microsoft Sentinel, your Azure tenant must have the following:
- a fully licensed Azure Active Directory (Azure AD);
- a paid Azure subscription;
- relevant permissions assigned; and
- a Log Analytics workspace created and ready for deployment.
How to set up logging within Microsoft 365
To support Office 365, Microsoft Sentinel requires specific log ingesting. The minimum logs needed are the following:
- audit logs from Azure AD;
- sign-in logs from Azure AD;
- activity logs from Office 365;
- alerts from Microsoft 365 Defender;
- alerts from Microsoft Purview;
- message trace logs from Exchange Online; and
- Microsoft Secure Score recommendations.
You can also add Azure Activity Directory Identity Protection and Microsoft Defender for Office 365 Plan 2 threat investigation and response to feed more information to Microsoft Sentinel for a more rounded view of potential threats.
Most Microsoft 365 workloads create logs by default, but you must enable both administrator and user audit logging:
- Navigate to the compliance.microsoft.com URL.
- Click Audit.
- Click Start recording user and admin activity.
Allow up to 60 minutes for the change to take effect.
How to set up the Log Analytics workspace for Microsoft Sentinel
First, create a Log Analytics workspace as the container for the Microsoft Sentinel ingested data. To start, navigate to the Azure portal at portal.azure.com, click within the search bar and type Log Analytics.
Click Log Analytics workspaces, click Create and then populate the required details.
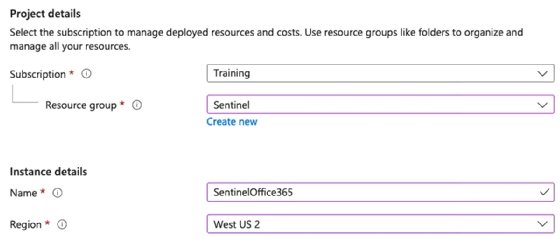
Once your tenant meets these prerequisites, go to Microsoft Sentinel within the Azure portal, click Create and then select the Log Analytics workspace you want to add within Microsoft Sentinel.
To start, Microsoft gives a 30-day trial that allows ingestion up to 10 GB of data daily.
How to connect Microsoft Sentinel with Office 365 logs
With Microsoft 365 services now logging data, the next task is to make a workbook that connects Microsoft 365 logs with Microsoft Sentinel.
In Microsoft Sentinel, click the workbook link and enter Office 365 in the search bar.
Click Save to add the workbook to your Microsoft Sentinel. Pick the same region you chose for the Log Analytics workspace, which you can adjust this as needed.
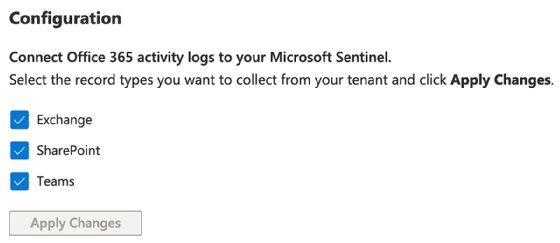
Once the status reads Connected, then Microsoft Sentinel can query the logs from Office 365. However, you need to specify the items to retrieve in the connector. To do this, click Data connectors, search for Office 365, select the main Office 365 connector and click Open connector page. Depending on the connector, check the appropriate boxes and click Apply changes.
Once active, the connector will receive data from the various workloads. You can add extra data connectors to match the minimum list for identifying threats within Office 365, including Azure AD log types, Microsoft 365 Defender logs, Microsoft Defender for Office 365 alerts and Azure AD Identity Protection alerts.
Data connectors may require extra licensing or a specific configuration to ensure the logs ingest into Microsoft Sentinel. Log entries can take up to 24 hours to become visible within the Log Analytics workspace and Microsoft Sentinel.
For testing purposes, you can use the Microsoft Sentinel training lab, which provides sample data and workbooks, to understand how to work with the product.
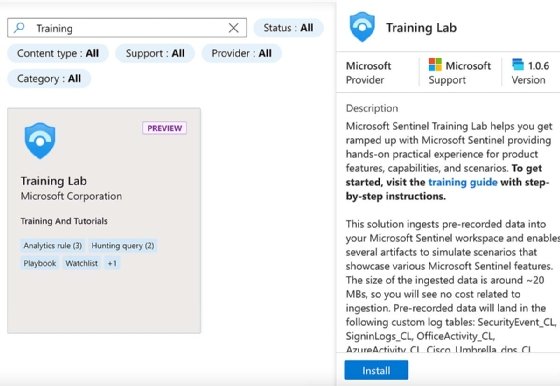
Click Install to initiate an automated deployment for all the required data, functions and workbooks.
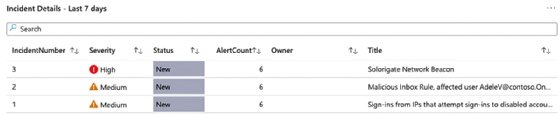
After the deployment, you can access the log data and view any specific incidents. The Workbooks area will feature a workbook named Investigation Insights, which will show all incidents in the last seven days by default.
The Content hub shows other workbooks available for review.
How to use the Microsoft Sentinel dashboard and interpret Microsoft 365 events
After about 24 hours, content should appear for review within Microsoft Sentinel. The exact amount of time may differ based on the number of data connectors and workloads.
At this point, you can start the assessment process. The Microsoft Sentinel dashboard provides information about specific events, alerts and incidents. You can click into each type to drill down into the raw data.
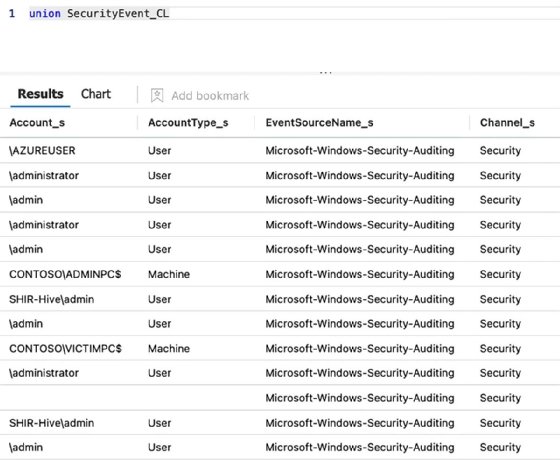
Clicking a category takes you into the raw log, where you can execute specific queries to filter the required data. The query language used within Microsoft Sentinel is called Kusto Query Language (KQL). KQL queries issue a read-only request for processing data, then return results. For example, when clicking Security Event within the chart, the query union SecurityEvent_CL executes. This is like running a standard SQL query, such as SELECT * FROM Table.
Within the Logs view, you can execute any query from a single table to joined tables to specific filters. In the left navigation, you can expand the Log Management, Microsoft Sentinel and Custom Logs values to see the actual tables of results.
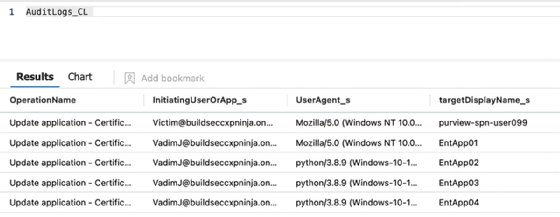
Selecting a different table lets you to execute a query specifically for that table. Delete what is currently in the query panel; double-click the required table, such as AuditLogs_CL; click Run; and view the results. Log Analytics uses the _CL suffix to denote a custom log.
Though querying logs are helpful, the most critical feature of Microsoft Sentinel is identifying potential threats. Microsoft added pre-built queries relating to multiple categories that assist with this effort.
Expand the Security section to execute a query for Accounts Failed to Logon or Activity From IP to view All Sign in Log Events.
Double-clicking All SigninLogs events returns this query:
- SigninLogs
- | project
- UserDisplayName,
- Identity,
- UserPrincipalName,
- AppDisplayName,
- AppId,
- ResourceDisplayName
- | project
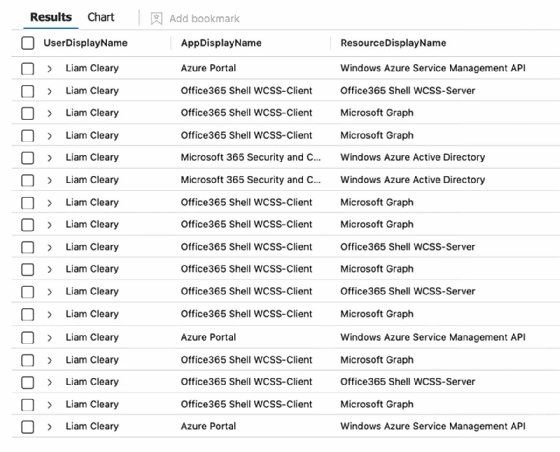
You can click the > icon, which resembles a right-angle bracket, to expand the result and view further details.
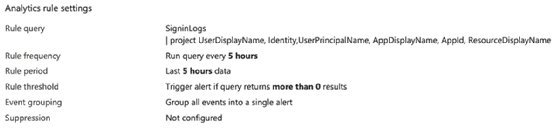
Suppose you identify specific events you want alerts for after executing the query. In that case, you can click the New alert rule and choose to create either an Azure Monitor or Azure Sentinel alert. Within the alert wizard, you set the name, description, associated tactics and techniques, and severity. The logic for the alert is populated automatically with the query you executed within the logs.
Next, define the schedule to run the query, set any values for creating incidents when events match the query and perform automated responses.
An automatic response could be a Microsoft Sentinel playbook or a crafted condition and action, such as executing a playbook, updating the status, changing the severity assignment and adding owners and tags.
Security threats and events are automatically flagged based on rules added to Microsoft Sentinel from the data connectors and content hub. You will see these listed as incidents within Microsoft Sentinel.
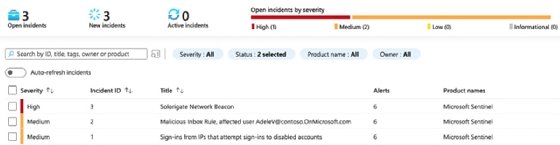
Clicking on the incidents page displays the current open, new, and active incidents. To view further details about specific incidents, check the box. From the right, a panel will display all the details, allowing you to set who it is assigned to, the status and severity.
To view further details, click the View full details button. To perform an action, select from the Actions button and choose either Investigate, Run playbook, Create automation rule or Create a team.
The view details link takes you to an investigation dashboard where you can see the actual events and associated information.
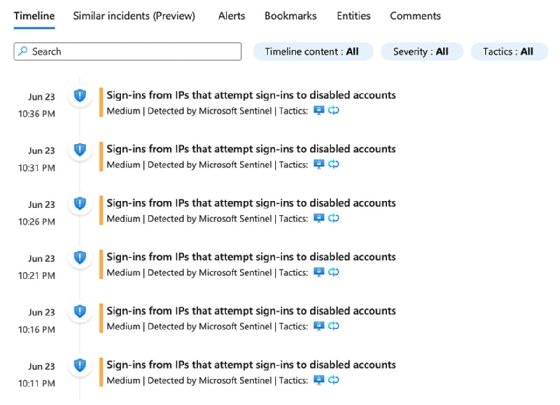
Finally, if you need to view the raw data for identified objects, such as a group of actions, you can click the view all X entities in the raw logs to create a KQL query for those objects:
SecurityAlert
| summarize arg_max(TimeGenerated, *) by SystemAlertId
| where SystemAlertId in("556601cc-6941-e60c-6228-0ee61fa12cc7", "3796bb51-26c1-aa72-2b27-23f976ccbd59", "08a84edc-52ef-63a5-8099-881143b18261", "e3e0a06e-5010-c88e-03d0-bd3c3f490347", "aacdda0a-31c3-3b46-f17c-3bfcc86d40c0")
| where AlertName == 'Malicious Inbox Rule, affected user [email protected]'
Give Microsoft Sentinel a test run
As you can see, Microsoft Sentinel provides excellent tooling to help you not only ingest log files from multiple sources but also run queries, get notifications, and take action against security threats and events.
It is highly recommended to take advantage of the free Microsoft Sentinel trial to see how it can benefit you and your security teams with their investigations. Microsoft offers a free trial for the first 31 days with a limit of 10 GB per day for log-ins to new workspaces.