Augmented analytics reveals the hidden side of things
The rise of augmented analytics empowers businesses to find correlations in data that might very well be the critical difference in operational efficiency and cost savings.
A reasonable person could assume that healthcare costs are higher for the chronically ill than for the typical adolescent, and the best way to lower costs is to first examine all aspects of care for those suffering from illnesses. But this type of assumption -- the kind that ignores hidden factors -- can lead companies down the wrong path.
One U.S. health insurance company encountered this situation while examining the of cost care using Salesforce's AI-infused analytics tool, Einstein Discovery. The insurer's CFO had always tracked cost metrics based on the sickness of patients -- the sicker the person, the costlier the care in terms of staff, equipment and other factors. The company decided to use augmented analytics to see if they were overlooking anything. Big data was ingested and fed to algorithms and models running in parallel to explore all the possible combinations and permutations of factors driving costs, explained Gartner analyst Rita Sallam, who led a recent webinar on the ways augmented analytics is transforming BI.
Surprisingly, the insurance company discovered that children under 12 were the biggest cost driver, because its contract allows ambulance companies to charge per person in the vehicle, and children typically have at least one parent accompany them to the hospital.
"They would never have found that had they continued to look at their data the way they always did," Sallam said during the webinar. "Their hypothesis was that sicker people tended to drive costs -- and there was a relationship with that -- but their biggest cost driver was something they never thought to look for, because to do that would have required manual exploration of relationships they would have had to have known about in advance."
This example clearly showed how the collection vast amounts of data can make it difficult, if not impossible, to see all the possible correlations. Sallam shared another salient example, taken from a Gartner BI Bake Off, in which analytics software vendors received public data sets on the U.S. opioid crisis and were asked to find the most important insights in that data. A small augmented analytics vendor called Stories.bi -- acquired by Workday in July -- was the only company to auto-generate a list of the top trends, including the most dangerous route to heroin use through specific drug prescriptions.
Stories.bi's augmented analytics software also revealed which states were saving lives through government programs that were beginning to reverse the opioid crisis. Rhode Island came out on top -- a result that seemed odd because the state's overall opioid abuse trend was still upward. Then came the aha moment when the company Googled the phrase "heroin in RI," which yielded a unique treatment program kicked off by the Rhode Island Department of Corrections in 2016 and whose results correlated with the decline in heroin deaths, Sallam explained in the webinar.
"Comparing augmented analytics to using visual-based BI exploration tools to uncover insights is that, with [the traditional BI] approach, you have to have an idea of the relationships, and if you aren't aware of a relationship between data, you won't explore it," Sallam later said in an interview. "That's the drawback, particularly as data becomes bigger with more variations."
AI-infused analytics tools
Traditional BI involves manually exploring and preparing data, manually testing models, finding patterns in data and sharing those patterns with business leaders. Those who do the analysis have the power to decide what's important, and anything outside of their purview is left unexamined.
Compared to BI, augmented analytics improves overall speed and accuracy, and, because more data can be analyzed, it can potentially reduce data bias. Data discovery and prep are faster as algorithms are applied to data to automatically search for patterns, while features, models and code are auto-selected. Insights are narrated using natural language processes, or visualizations are created to show what's important.
approaches to business analytics include AI within the analysis process itself. With augmented analytics, for example, you can ask a question concerning a drop in sales to derive insights from areas you normally wouldn't consider.
On the data science side, traditional vendors such as SAS and a host of newer software vendors like DataRobot are adding AI to data prep, analytics processes and building models, Sallam said. Outlier AI, BeyondCore (acquired by Salesforce), Empirical Systems (acquired by Tableau), Qlik, Microsoft and other BI vendors have also invested in augmented analytics capabilities and offer varying levels of functionality.
"The user experience will transform quite a bit over the next few years," Sallam noted. "If you are dealing with an analytics vendor, monitor their roadmaps regarding this capability."
Like any analytics tools, augmented analytics software requires large amounts of good, quality data that's related to the business area being analyzed, and if you don't have the data infrastructure, Sallam added, you don't get the analytics. "I wouldn't suggest people have the perfect data in a data lake before piloting augmented analytics; you can start with a smaller data set to prove out the value in solving business value," she said. "I encourage organizations just to begin. That first mile is the hardest."
Automate BI with skepticism
While augmented analytics can reveal incredibly valuable information, data analysts have to maintain a healthy skepticism when working with these black box systems. For one, if you feed the algorithm biased data that doesn't represent the full spectrum, then you won't get the right results, Sallam said. "Bad data, whether explored manually or in an automated way, results in bad insights or even dangerous insights," she warned.
It's not a question
if AI-assisted business intelligence tools will become the norm -- but
when.
Sallam encouraged companies to validate the accuracy of the data and algorithms by back-testing; look at historical data to see how well these systems would have predicted reality. An expert data scientist should be able to look at the model, test it and extend it to gain trust in the model's accuracy.
"It's really about transparency in the models -- proving value through testing and being able to source the results and verify the results on known data," Sallam explained. "That's the same with any analytics tool. If you come up with a result that people don't expect or don't want to hear, they want to see how you got it."
Data literacy is also critical with augmented analytics, so that people outside the data science team understand how to use data responsibly and know what to do with the insights they're given, she said.
And as AI automation changes the way technology works, it also changes the way people do their jobs. Sallam advised companies to plan for possible changes in worker roles, responsibilities and skills.
"You may have to invest in data literacy, new data governance policies," she suggested. "The thinking here is to look at not only how this impacts your tools, but also your processes and skills."
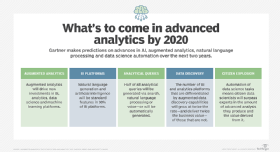
We don't need augmented analytics to help us conclude that it's not a question if AI-assisted BI tools will become the norm -- but when. Read on to learn more about the tools, technologies and skills necessary to meet the business challenges in the years ahead.