16 metrics that matter in cloud performance monitoring
Compute cost and requests per minute are just two of the metrics that keep cloud performance humming. Here's how cloud metrics differ from on-premises, plus advice on buying tools.

For more than two decades, IT teams have been deploying application performance management tools to monitor and manage on-premises applications and infrastructure. But when organizations move to the cloud, these APM strategies need to evolve.
Cloud APM requires an organization to track more metrics than on-premises APM, and there are additional considerations to weigh that are unique to cloud environments. Here's an explanation of how they differ, the most important metrics and tools that help collect and analyze them.
What's different about cloud APM?
At first glance, cloud environments and on-premises environments might not seem radically different as far as application monitoring is concerned. Cloud applications still run on servers -- usually, anyway -- and they handle transactions in ways that typically are similar to on-premises apps.
You can use certain monitoring approaches both on premises and in the cloud. For example, the RED method emphasizes collecting metrics related to transaction rate, error and duration.
This article is part of
What is cloud management? Definition, benefits and guide
Cloud environments, however, pose additional challenges. When planning which metrics to monitor, IT teams will need to account for the following:
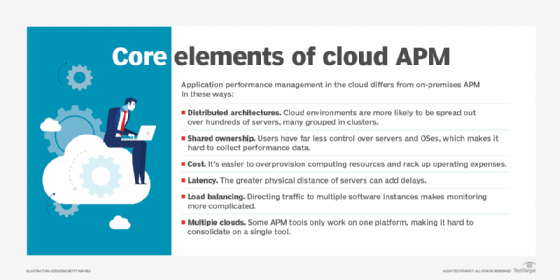
- Distributed architectures. Cloud environments are more likely to include dozens or even hundreds of individual servers, with applications distributed across them. This makes it more important to monitor not just individual servers but entire clusters. What matters most in the cloud is the health of your cluster, not each server in it.
- Shared ownership. In cloud environments, users don't typically have total control over host servers and operating systems, which are instead managed by the cloud provider. This can make it more difficult to collect certain types of data. For example, you can't pull OS logs from most cloud-based serverless compute services because you don't have access to the operating system.
- Cost. Overprovisioned cloud environments can bloat cloud computing bills. This makes it more important to use cloud monitoring to help support cost optimization in addition to performance optimization. Of course, cost matters on premises as well. Overprovisioning is less problematic in that context, though, given that the bulk of on-premises costs result from capital expenditures rather than operating expenditures.
- Latency. Achieving low latency should be a goal for any type of application. When dealing with cloud-based apps, however, latency might pose more of a challenge. If the cloud data center is located far from your users, there's a higher risk of latency problems.
- Load balancing. Although you might sometimes use load balancers for on-premises applications, it's more common to use them in the cloud to direct traffic between multiple instances of your application. This adds another layer of complexity to network and traffic monitoring.
- Multiple clouds. If you use a multi-cloud or hybrid cloud architecture, it's harder to consolidate your APM toolchain around a single set of tools. For example, you can't use AWS CloudWatch alone to monitor all of your resources if you spread them across multiple clouds. CloudWatch works only with AWS.
All of these differences impact the approach that teams need to take to monitor and manage applications in the cloud.
Key cloud metrics to track
For virtually any type of cloud environment, you'll want to track the following metrics or metric types:
- CPU utilization. CPU utilization shows what percentage of available CPU resources are being actively consumed. It's important for two main reasons. First, it helps identify instances where CPU resources are starting to run short, meaning you should allocate more to prevent performance issues. Second, if CPU utilization is low, it could be a sign that you've allocated more CPU resources than you need, and that you could modify your configuration to reduce cloud costs.
- Memory utilization. Similar to CPU utilization, memory utilization shows how much memory workloads are consuming as a percentage of total available memory. High memory utilization is a sign that admins should allocate more memory to prevent workloads from slowing down. Some types of cloud services or platforms, such as Kubernetes, will kill processes if there is not enough memory, which means applications could totally shut down, not just slow down.
- CPU time. In addition to CPU utilization, some cloud services -- AWS Lambda, for example -- report metrics related to CPU time. This refers to how long CPU resources were used to complete a process. This can be a useful metric to track in scenarios that involve time-sensitive tasks, such as processing files that users upload. If CPU time is high, processes could take longer. However, allocating more CPU resources could speed processing, leading to a better user experience.
- Requests per minute. By tracking how many requests a cloud application receives per minute, you will know the times of day or days of the week when request rates deviate from historical baselines. This enables an organization to more accurately predict when to increase the capacity for cloud resources. You can also use this type of metric to help identify problems, such as DDoS attacks.
- Time to acknowledge. Tracking average time to acknowledge, which refers to the time it takes for your cloud-based app to start responding to a request, might reveal issues related to load balancers that fail to forward requests quickly enough. A slow time to acknowledge could also indicate an application is underprovisioned and struggling to handle all its requests. For the best visibility, monitor and compare time-to-acknowledge metrics for each cloud region or individual cloud that you use, rather than analyzing them only in the aggregate. This will help you pinpoint latency issues that might be specific to one cloud region or cloud. Comparing acknowledgement time when a given request is and is not handled by a content delivery network will also help you understand how best to minimize latency.
- Response duration. Response duration, or the total time it takes the application to complete its response to a request, is also an indicator of whether your application has sufficient resources to handle the traffic directed at it. In addition, problems with response duration could indicate bugs or internal communication issues -- such as the failure of one microservice to communicate efficiently with another -- inside the application itself. Response duration should also be tracked on a per-region and per-cloud basis to achieve the greatest visibility into latency.
- Error rates. How often does a request result in an error? Which types of errors are most frequent? These metrics offer further visibility into the overall health of your application as well as the cloud environment that is hosting it. Errors could reflect an application issue, but they can also indicate problems with your cloud environment itself, such as the unavailability of a cloud service -- which is typically an issue the cloud provider needs to resolve -- or improperly configured access credentials for services running within your cloud environment.
- Latency. Latency refers to the delay between when a request or action is initiated and when it is completed. For example, the time it takes a network packet to move from a point of origin to its destination is a measure of network latency. Likewise, a delay between when an application receives a user request and when it completes processing of it is a form of application latency.
- Network round-trip time. Network round-trip time measures how long it takes for a request to travel over the network, reach its destination and then travel back to its place of origin. Round-trip time might be equal to double network latency, but processing delays at the traffic's destination can make round-trip time longer. Thus, comparing round-trip time to latency helps determine whether slow performance is caused by issues with your network itself or with the way applications are processing data on the network.
- Packet loss. Packet loss shows how many packets fail to arrive at their intended destination. The most common cause of packet loss is congestion. In most cases, lost packets are automatically retransmitted, so packet loss doesn't mean you're losing data. However, high packet loss metrics could be a sign of a cloud networking problem, such as lack of sufficient bandwidth or configurations that are causing your applications to flood the network with more data than necessary.
- Servers or nodes available. For distributed cloud environments, you should track how many servers or nodes in your cluster are up and available as a percentage of the total servers you have deployed. Although your cloud orchestration and automation tools might do a good job of automatically redistributing workloads from one node to another if a server goes down, they can only do that for so long before running out of healthy servers. You'll want to know if the number of available servers decreases beyond about 90% of the total deployed, which could indicate a serious problem with your cloud server instances.
- Average compute cost. Tracking the total average cost of your cloud-based compute resources, such as virtual machines or serverless functions, in a given period will help you control costs. A spike in compute cost that can't be explained by a corresponding increase in application demand could signal an overprovisioned environment, for instance, which will waste money until it is corrected.
- Mean time to resolve. Mean time to resolve metrics, which measure how long it takes your engineers to respond to incidents that occur in your environment, are important to track in any type of environment. But given the complexity of cloud environments, they can be especially important to watch when dealing with cloud-based apps.
- Average storage cost. You can also track the average cost of your cloud storage resources, including databases, object storage and block storage. Here again, storage cost increases that aren't tied to actual application needs could indicate a problem, such as improper data lifecycle management or inefficient use of data storage tiers.
- Deployments per week or day. If you use a CI/CD pipeline to deploy applications continuously into the cloud, measuring how many deployments you achieve per week -- or day, if you deploy particularly often -- will help you understand the overall health of your CI/CD operations.
- Time to feature release. Along similar lines, tracking how long it takes your team to take a new feature from idea to deployment provides visibility into the efficiency of your CI/CD pipeline.
The specific metrics you'd collect in each category will depend on which types of cloud services you use and which metrics they expose. These metrics vary from one cloud platform to the next, but they are usually well documented by cloud providers. You can read all about the metrics exposed by Amazon EC2 or Azure Virtual Machines, to name just two basic examples of cloud services.
Cloud APM tools, services and providers
A variety of tools and services are available to help collect and analyze cloud metrics. They fall into two broad categories:
- Products from cloud providers. Examples of such products include Amazon CloudWatch and Azure Monitor. These tools usually only work with one cloud platform, although there are exceptions: Azure Monitor has some support for analyzing AWS logs and metrics, for example.
- Third-party APM software. These typically offer the advantages of being compatible with multiple cloud platforms. They might also offer more advanced analytics, visualization and recommendation capabilities than cloud providers' native tools -- although the latter have grown increasingly sophisticated in recent years and are not necessarily inferior, from a features perspective, to third-party APM tools.
If you're new to cloud monitoring, using cloud providers' tools is usually the most straightforward way to get started collecting metrics and analyzing them for basic patterns. But for more advanced features, or to help support a multi-cloud strategy, consider using third-party products. Remember, too, that in most cases, you can use both types of tools at the same time. You might use CloudWatch for basic metrics analysis on AWS, for example, while also using a third-party APM tool that provides additional capabilities.
Whichever APM tools you choose or which cloud metrics you ingest into those tools, your main focus should be on collecting information that helps you understand the state of your complex distributed cloud environments.
You should also strive to correlate data of different types and compare data across different clouds and services. This way, you can achieve full visibility into the performance -- and cost -- problems that might arise in the cloud.
When you have a detailed look at what's happening, you'll be in a better position to prevent complications and improve the performance of a cloud deployment.
Chris Tozzi is a freelance writer, research adviser, and professor of IT and society who has previously worked as a journalist and Linux systems administrator.