Getty Images/iStockphoto
Implement these 4 Amazon CloudWatch Logs best practices
To improve the reliability of their applications, AWS users might want to consider exporting log data to the cloud for analysis and pattern detection.
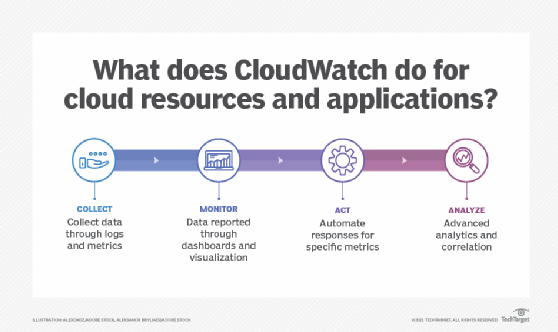
Enterprises need to monitor resources and applications to control various factors such as performance and cost. Amazon CloudWatch provides a view into the overall health of application resources and services. An important aspect of monitoring is logging.
Amazon introduced CloudWatch Logs in 2014 as a way to export log data from application servers into the cloud, where users can preserve, analyze or use data to trigger various actions. The service has evolved to a point where it not only stores custom application logs, but also can be used by multiple AWS services to log event information. Some popular AWS services that users can configure to store event and operational data in CloudWatch Logs are the following:
- Amazon Relational Database Service
- AWS CloudTrail
- AWS CodeBuild
- Amazon Cognito
- AWS Elastic Beanstalk
- Amazon ElastiCache
- Amazon Simple Notification Service
- Amazon Virtual Private Cloud (VPC)
Additionally, AWS Lambda functions store log data in CloudWatch Logs by default. API Gateway can be configured to do the same.
Follow these four best practices on exporting logs, configuring metrics, collecting insight and controlling costs to get the most from CloudWatch Logs.

Export logs
Exporting logs to CloudWatch Logs is an essential part of setting up scalable, stateless architectures, where services such as AWS Auto Scaling can launch and terminate EC2 instances as needed. To export custom application logs into CloudWatch Logs, you install the CloudWatch agent in application servers. This can be done in either on-premises servers or in EC2 instances. Many EC2 Amazon Machine Images, or AMIs, come with the CloudWatch agent package ready to be installed.
After installing the agent, developers configure the location of local logs that will be exported -- e.g., /var/log/apache/access.log and /var/log/apache/error.log -- and other settings, such as timestamp formats or export frequency.
A team can also export CloudWatch Logs data to other AWS services using the subscription filters feature, which integrates with the following:
- AWS Lambda
- Amazon OpenSearch
- Amazon Kinesis Data Streams
- Amazon Kinesis Data Firehose
Developers can configure conditions and filters regarding how the log data will be exported. This feature enables more complex analytics, actions and storage options for log data. You can export logs directly to Amazon S3, where they can be analyzed using AWS services, such as Amazon Athena, Amazon Elastic MapReduce or Amazon Redshift.
Configure metric filters
Once logs are stored in CloudWatch Logs, some interesting actions become possible. A user, for example, can configure metric filters to extract patterns from logs and convert them into CloudWatch metrics, which can then be monitored in CloudWatch dashboards or used to trigger CloudWatch alarms.
For this feature to work properly, applications need to log relevant events in a consistent way to extract data as a pattern. For example, with an online store, each time a customer buys a product, the application can log a consistent message, such as action=customer_checkout. That message can then be extracted and converted into a CloudWatch metric.
Or, when a particular error happens, a consistent message can be logged -- for example, error_type=database_connection_timeout. This consistency can help an organization monitor and resolve specific system and application errors.
Collect insights
CloudWatch Contributor Insights integrates with CloudWatch Logs to deliver enhanced visibility and analytics into log data. The feature can parse and aggregate patterns in log data in a visual way. Users can export results from Contributor Insights to a CloudWatch dashboard to visualize data, such as the top URLs in a web application.
Meanwhile, CloudWatch Logs Insights exposes a query language that can be used to analyze log data. This query language is specific to Logs Insights -- it is not compatible with known syntax such as SQL -- but it is not difficult to learn. It supports features such as comparisons, numeric and datetime functions, regular expressions and aggregations, among other ways to extract relevant information from log entries.
Users can query well-known log patterns, such as Apache or Nginx access logs; extract information, such as error code aggregations; or calculate average response times per URL and so on. User can also export outputs from Logs Insights to CloudWatch dashboards, where they can be visualized to further help with operational activities.
Control costs
Enterprises need to pay special attention to expenses. The CloudWatch Logs data ingestion fee is $0.50 per gigabyte, which can turn into a significant amount for high-volume applications. It's not uncommon to see situations where data ingestion reaches thousands of dollars.
High-volume Lambda functions or EC2-based applications with verbose logging can result in a high ingestion cost. For native integrations, VPC Flow Logs can result in thousands of dollars in AWS accounts that have significant traffic and many components in a particular VPC.
At $0.30 per gigabyte, data storage can also add up. It's important to keep data retention to a minimum, depending on application needs. An organization that needs to retain data for the long term could reduce its costs by exporting that data to S3.
From a security point of view, log data is encrypted by default using AWS Key Management Service. If sensitive data is stored in logs, security teams can configure AWS Identity and Access Management policies to restrict access so that only certain users see certain logs.


