
Getty Images
When and how to search with Amazon CloudWatch Logs
Logs can reveal important information about your systems, such as patterns and errors. Learn how to search logs with CloudWatch Logs, key concepts and other options.

Amazon CloudWatch Logs delivers storage, processing, analysis and monitoring for a wide variety of log data from multiple sources -- such as other AWS services. The service offers search functionality and integration capabilities with more sophisticated mechanisms for more detailed log analysis, at any scale.
Developers can configure their applications to export log data to CloudWatch Logs instead of keeping it in their own servers or EC2 instances. Once log data arrives to CloudWatch Logs, developers have the option to configure a retention period, export it to Amazon S3 or trigger custom actions on incoming log events. There is also the option to search and analyze log data directly in the CloudWatch Logs service.
Follow this step-by-step CloudWatch Logs tutorial, and explore other tools to work with log data.
Log events, groups and streams
There are three main CloudWatch Logs concepts users need to know.
Log event. When a monitored app or resource records an activity, it creates a log event. The event receives a timestamp and the raw event message.
Log groups. A log group is the top-level grouping related to log data.
Log streams. Streams are a way to group incoming log events within a log group.
For example, AWS sends log events related to a Lambda function into a log group dedicated to that particular function. Events are broken down into log streams that contain log events for specific executions.
For custom logs, such as Apache access logs generated in EC2 instances, it is a common pattern to create a log group for the application and log type -- i.e., access and error -- and then one log stream per EC2 instance. When developers configure custom application logs, they can specify how to group log events into log groups and log streams. For AWS built-in logging, the granularity of log groups and log streams are defined by each AWS service that sends data to CloudWatch Logs.
How to perform a search with CloudWatch Logs
AWS has many options to execute searches on log data. The simplest one is through the CloudWatch Logs console.
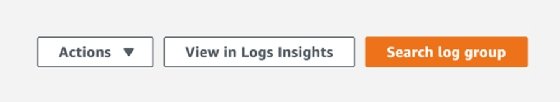
Step 1. Select the applicable log group. There's an option to select a particular log stream or to search all events within the whole log group.
When selecting a particular log group in the log groups screen, the console offers the menu shown in Figure 1.
Step 2. After clicking Search log group, the console displays Figure 2, which is also displayed when users click on a particular log stream.

This gives users the ability to choose a relative time range or to select a custom time range with specific start and end timestamps. This functionality executes a text-based search in the selected log data which allows for a simple way to find specific text at the log group or log stream level.
This option supports filter patterns in the search box, such as the following examples:
- STRING. This pattern would search for STRING in the selected log data.
- ?STRING1 -STRING2. This pattern would search for log events containing STRING1, but exclude those with STRING2.
- ?STRING1 ?STRING2. This pattern would search for both STRING1 or STRING2
For space-delimited logs, such as Apache access logs, search filters can parse and filter specific fields. The following is a sample record in an Apache access log for a failed health check from Application Load Balancer (ALB):
10.1.11.111 [1/Jun/2022:10:10:10 +0000] "GET / HTTP/1.1" 500 800 "ELB-HealthChecker/2.0"
The fields in this example can be parsed using the following pattern:
[ip, timestamp, request, status_code, bytes, user_agent]
Records that failed ALB health checks could be searched using the following filter, which would return log events with an "ELB-HealthChecker" user_agent and status_code with value 500:
[ip, timestamp, request, status_code=500, bytes, user_agent="ELB-HealthChecker*"]
AWS SDK and CLI
For automation purposes, developers can also use the AWS SDK or CLI to search CloudWatch Logs. The filter-log-events CLI command can be used in the following way:
aws logs filter-log-events --log-group-name '<log-group-name>' --start-time <timestamp-epoch-milliseconds> --filter-pattern '<search-string-or-filter-pattern' --region <aws-region>
The CLI allows for other fields, such as end-time, log-stream-name, log-stream-name-prefix and max-items for further refinement of search parameters.
CloudWatch Logs Insights and other tools
CloudWatch Logs Insights is also a popular option to search logs. It offers a query syntax language that can be used to filter, parse and aggregate log records within a given time period. This tool allows for a more detailed search functionality compared to the standard text search.
Since log data can also be exported to S3, this allows for detailed analysis using Athena or other data analytics platforms available through AWS EMR. This is a feasible option for applications that produce a large volume of log data or require long-term log data retention. To analyze log data in S3 using tools such as Athena, ensure log records have a consistent pattern that can be parsed into table columns that will be used by Data Definition Language statements required by data analytics tools.
Subscription Filters is another useful feature that can be used to transform and export log data into multiple services and execute further search and analytics processes. Target services include the following:
- Amazon Kinesis Data Streams. This serverless, real-time data stream service collects, processes and stores large amounts of data
- Amazon Kinesis Data Firehose. This extract, transform and load service captures, transforms and loads streaming data to data lakes, warehouses and analytics services.
- Amazon OpenSearch. This open source search and analytics suite enables developers to view and analyze data.
- AWS Lambda. With this serverless service, developers can use Lambda functions to transform and export log data to other services, such as S3 or Amazon Redshift, or external data analytics platforms.
Dig Deeper on Cloud app development and management
-
![]()
AWS Machine Learning Certification Exam Dumps and Braindumps
By: Cameron McKenzie
-
![]()
Certified AWS Security Specialist Exam Dumps and Braindumps
By: Cameron McKenzie
-
![]()
Sample Questions for AWS' Security Specialist Certification
By: Cameron McKenzie
-
![]()
Professional DevOps Engineer Exam Dumps and AWS Braindumps
By: Cameron McKenzie


