
Use Glances to monitor your data center systems
Glances is a real-time, Python-based performance monitor. Administrators with data centers that house multiple OSes should consider installing Glances.

System monitoring tools, like Glances, offer data center administrators two advantages: Ensure the system is not overwhelmed and provide preventive maintenance.
Today's OSes provide many tools to make monitoring data centers easier. Common performance monitoring utilities include top and htop for Linux, top for macOS, and Task Manager and Resource Monitor for Windows.
Glances is an open source, cross-platform monitoring tool written in Python that can run on all three OSes. This enables admins to display the same performance data across systems. Glances collects performance data from CPU, memory, storage, networking, sensors and containers.
This article provides installation steps and basic use for Glances in a data center.
Install Glances
Glances relies on Python 3. MacOS and Linux distributions include Python. Downloads and documentation are available for Linux, macOS and Windows from the Python website.
Glances is installable once Python 3 is in the system.
Add Glances with pip
Python includes the pip package manager that can install Glances. Python documentation notes that on some Debian/Ubuntu-based distributions, it might be necessary to add the python-dev package. The same package is called python-devel for Red Hat/Fedora-based distributions.
Type the following pip command for a basic Glances installation:
pip install --user 'glances'Or type the following command to install all Glances features:
pip install --user 'glances[all]'One major benefit of the full installation, especially in a data center environment, is access to the Glances web interface.
Update Glances by running the following:
pip install --upgrade glances
pip install --upgrade psutil
pip install --upgrade glances[all]
Add Glances using the installation script
Glances documentation claims pip is the standard installation method, but the auto-install script is the easy way. The script works on many common Linux distributions and macOS.
Use one of these commands to download and run the script:
curl -L https://bit.ly/glances | /bin/bash
wget -O- https://bit.ly/glances | /bin/bash
Other ways to add Glances
If you prefer to use Homebrew on your macOS box instead of the installer script, type the following:
brew install glancesThe developer also offers Docker images. Running Glances in a container avoids installing the Python components directly on the local system. This is useful for secured servers or ones that are frequently rebuilt. To get the Docker image, type the following:
docker pull nicolargo/glances:latest-fullAdd automation to Glances with infrastructure-as-code configuration tools like Ansible, Chef and Puppet.
Glances interface
Type the glances command to start the tool. Use the q command inside Glances to close it and return to the command prompt.
What Glances tells you
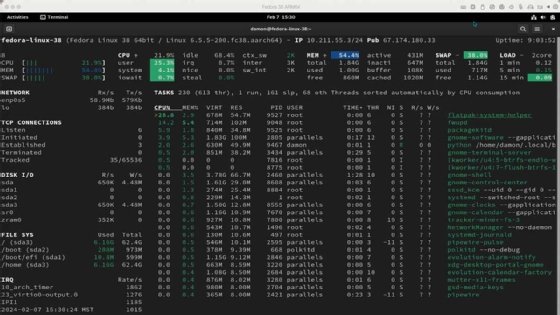
The top of the Glances interface shows a summary of CPU and memory statistics. If only a bar graph appears, zoom out of the terminal window to provide more space.
You can toggle between a consolidated CPU or per-processor view by pressing the 1 key.


The bulk of the display resembles top, with a listing of processes and related resource consumption information. The output is dynamic.

Glances displays warnings and alerts toward the bottom, which enables a preview of potential errors that impact system stability.

Finally, Glances displays a useful sidebar that summarizes system network, disk and filesystem performance. Toggle the disk and filesystem information using the d and f keys. Hide or show the network information with the n key.

Sensor data also appears, which includes data on temperature and other values that depend on the system's configuration.
Press the h key while in Glances for a reference menu.

Select the q or ESC key to exit Glances.
Monitor data center systems with Glances
There are multiple advantages for Glances being Python-based, which include the following:
- Simple, flexible updates and automated deployments across platforms.
- Consistency of gathered information across hardware and OSes.
- Consistency of collected information to parse, interpret and archive.
Administrators only need to learn one UI. Access Glances on remote systems using SSH connections or the web UI. Glances includes a client-server mode, which enables administrators to monitor multiple systems.
Glances also monitors container performance on systems that use an API hosted on the container. More information is available in the Glances documentation.
Glances client-server mode
Start Glances on each remote server using the -s option to use the client-server mode. Launch Glances with the -c option and a target name or address from the workstation, or the client.
glances -s
glances -c @server
Configure the client with a server list for automatic browsing.
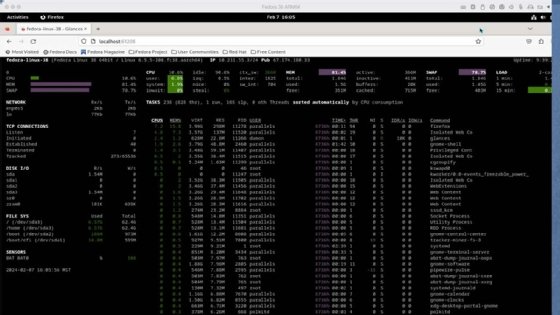
Glances web interface
Launch Glances in web mode to accept inbound browser requests for performance information. The interface shows the default port number.
glances -w
Connect to the Glances web server with a browser. The connection is http://localhost:61208.
Glances compared to other tools
The most important comparisons to make between Glances and other monitoring tools are consistency, automation and familiarity.
Glances is a real-time performance monitor, but it can also export information to various target formats and systems. For example, Glances can export to JSON, CSV, MongoDB and Prometheus.
One weakness of Glances compared to utilities like top and htop is that it is non-interactive. Glances displays performance information but does not enable the user to manage what they discover. Top enables users to renice or end processes while Glances provides information, but the user must find another tool to manage the system.
Damon Garn owns Cogspinner Coaction and provides freelance IT writing and editing services. He has written multiple CompTIA study guides, including the Linux+, Cloud Essentials+ and Server+ guides, and contributes extensively to TechTarget Editorial and CompTIA Blogs.