Dynatrace hands observability-as-code reins to DevOps
Dynatrace expanded observability-as-code tools to let developers and DevOps engineers determine how production services send feedback via a self-service interface.
New self-service observability-as-code features from Dynatrace put developers in control of how their production apps are monitored, but in some shops, getting developers to use such features can be a tricky sell.
Dynatrace users got their first look at a multi-pronged set of updates to the vendor's configuration APIs, Monaco command-line interface (CLI) and Cloud Automation product during the Perform virtual event this week. The updates, branded Software Intelligence as Code, expand the number of Configuration API settings developers can access through the Monaco CLI, and add access control guard rails that limit which production resources developers can configure.
Observability as code isn't entirely new to the market or to Dynatrace. Dynatrace application performance management (APM) rival New Relic offers alerts-as-code, while other competitors such as Splunk's SignalFx and Datadog automate observability tooling deployments as code through partnerships with HashiCorp Terraform. Dynatrace has offered observability-as-code features that integrate service-level objective (SLO) data into application testing pipelines since the heyday of its legacy AppMon tool, which the vendor replaced with the Dynatrace platform in 2019.
Within this week's Software Intelligence as Code release, some pieces, such as configuration security policies, were already available in preview last year, while others remain slated for delivery within the next 90 days.
"We are in [the process] of moving to an entirely new API framework," said Stefan Greifeneder, senior director of product management at Dynatrace. "We are applying this approach to more API endpoints, and within the next 90 days, we will have covered most of these. Sample endpoints include containers and processes, web and mobile applications, server-side services, tagging, alerting, notification profiles and synthetic monitors."
Other Dynatrace officials said this week's launch of Software Intelligence as Code, based on open source Monaco, is analogous to last year's general availability of its Cloud Automation platform, based on its open source Keptn project.
"While our efforts on open source and openness remain, our APIs and the command-line interface [Monaco] are ensured to keep up-to-date by our architecture -- with common declarative settings," said Wolfgang Heider, principal product manager at Dynatrace, in an online Q&A during the virtual event.
Dynatrace observability-as-code updates extend existing tools to accommodate developer self-service up to and including enterprise production.
IT ops pros sell dev teams on observability as code
Dynatrace's approach to observability as code is in keeping with post-pandemic enterprise IT trends, including the rise of DevOps platforms administered by DevOps or site reliability engineering teams that provide controlled self-service access to infrastructure by developers. Such platforms have coincided with an ongoing IT skills shortage and a dearth of "full-stack developers" that can manage both applications and the entire cloud-native technology stack.
Dynatrace's new set of observability-as-code tools isn't intended for full-stack unicorns, according to one Dynatrace solutions engineer this week.
"Developers still absolutely do not want to manage production," said Kyle Harrington, principal solutions engineer for North America West at Dynatrace, during the online virtual event Q&A. "[Developers can run] metric and performance data through Dynatrace to ensure all SLOs are met across environments, without needing to intervene or watch a silly dashboard, crossing [their] fingers that it doesn't turn red ... without manual instrumentation and without having to rebuild another Jenkins pipeline."
In some organizations, IT ops pros have already begun to integrate SLO-as-code tools from Dynatrace into DevOps pipelines on behalf of developers.
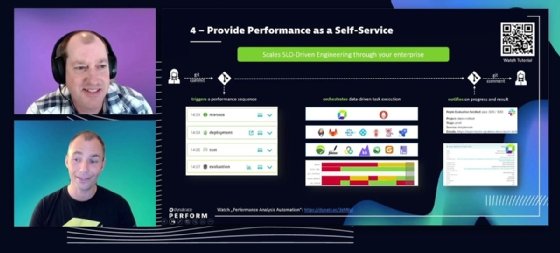
"As performance engineers, we know that when we run tests, there's thousands of lines of data to look at," said Michael Kobush, a software quality engineer at the National Association of Insurance Commissioners in Kansas City, Mo., in a virtual event presentation this week. "There's charts and graphs to go over, there's comparisons to look at, and then we've got to write a report and give that to our project teams -- this can take hours to do, but with Cloud Automation and SLO-based dashboards, we can decrease that time from hours to just seconds."
Kobush's co-presenter, Dynatrace developer advocate Andreas Grabner, said in the session presentation that he'd been talking about expanding self-service access to observability-as-code tools for years. But in a separate post-session online interview, Kobush said he's still working on getting development teams interested in SLO-based application testing.
The later you performance test, the less time you have to fix issues, so shifting left allows for a healthier app and saves money.
Michael KobushSoftware quality engineer, National Association of Insurance Commissioners
"I'm using one application team as a test to show others how much more productive we can be," Kobush said. "It's going to be a process ... [developers] don't want to deal with it. That's the struggle. What I tell them is, 'The later you performance test, the less time you have to fix issues, so shifting left allows for a healthier app and saves money.'"
Meanwhile, another Dynatrace virtual conference attendee said developer teams within his organization have been sold on observability-as-code self-service by the unpleasant experience of being without it.
"To be honest, I see the pain of not having observability being surfaced first from our developer engineers -- especially when they are blind-sided by a production triage or escalation under duress," said Mark Tomlinson, performance architect at an online payments company evaluating a switch to the Dynatrace platform that he requested not be named. "They have the most to gain from better introspection of the code as it is operating -- including code they didn't write -- to better comprehend how their own code is working at scale."
Developers also don't necessarily want to deal with reactively tracking down performance issues and then modifying observability configuration after the fact, said Scarlette Clayton, an IT selling systems analyst at Tractor Supply Co. in Murfreesboro, Tenn., who also plans to consider observability-as-code self-service for development teams.
"In some situations currently, we do not find out about an issue or exception until after the [incident response] period is over," Clayton said in an online interview. "If we can identify these earlier, we will be able to have the project team work on a fix for the issue instead of transitioning the issue to support for resolution."
Beth Pariseau, senior news writer at TechTarget, is an award-winning veteran of IT journalism. She can be reached at [email protected] or on Twitter @PariseauTT.