
Getty Images/iStockphoto
How to successfully debug PowerShell scripts
Got a PowerShell script that isn't working as intended? Debug it using breakpoints and a few simple steps in VS Code, and you'll be on your way to scripting success.

Most PowerShell scripts are complex, so it's nearly impossible to write a perfect one the first time. That's nothing to be ashamed of. You can always debug it.
Effectively debugging a PowerShell script is a critical skill for any script writer, from a new desktop support technician to a seasoned developer. You must understand how to use breakpoints and know how to navigate the debugger in the PowerShell extension for Visual Studio (VS) Code.
To follow along with the steps in this article, you must have PowerShell, VS Code and the PowerShell extension in VS Code. But there are no OS requirements. You can debug PowerShell 7 scripts in VS Code with the PowerShell extension on Windows, MacOS and most Linux distributions.
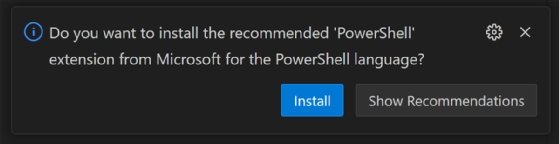
If you open a PS1 file in VS Code and you don't already have the PowerShell extension, you will be prompted to install it.
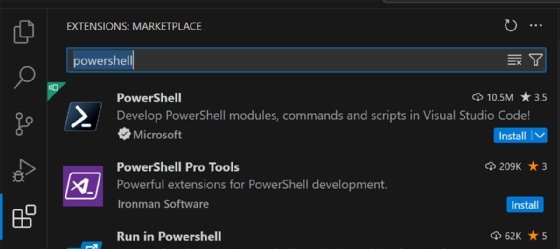
If you need to install it manually, go to the extension icon and search for "PowerShell."
Understand breakpoints
Breakpoints are user-specified points in the code where the debugger stops the code from executing to give you the opportunity to evaluate the state of variables before proceeding. This is valuable because it enables you to easily identify problems.
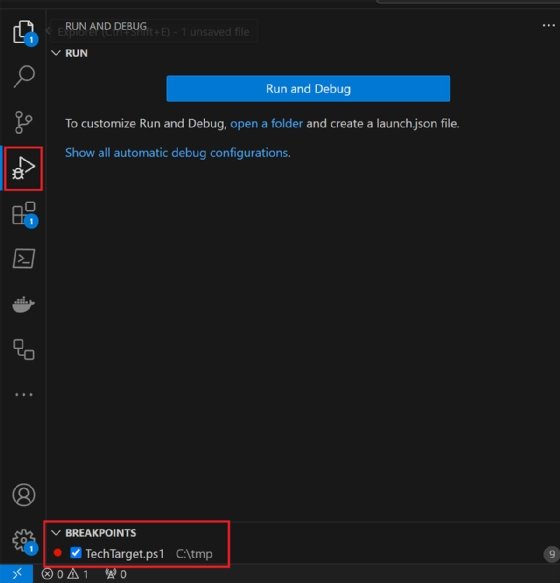
To set breakpoints in VS Code, put the cursor on the line that you wish to add a breakpoint to and press the F9 key. You can also hover your mouse over the left margin and click on the red dot, as shown in Figure 3.

Once you set the breakpoint, it will be indicated by a bright red dot, as shown in Figure 4.

Breakpoints also show up in the breakpoint list at the bottom of the debugger pane as seen in Figure 5. You can enable or disable breakpoints from the debugger pane.
How to debug
If you want to pull pricing data from Azure using the prices API, your script might look like the following.
$azPricesApiBase = "https://prices.azure.com/api/retail/prices"
$filters = @(
    "serviceName eq 'Virtual Machines'",
    "priceType eq 'Reservation'",
    "armRegionName eq 'westus3'"
)
$url = "$azPricesApiBase?$filter=$($filters -join ' and ')"

$items = & {
    $out = Invoke-RestMethod $url
    $out
    while ($null -ne $out.NextPageLink) {
        $out = Invoke-RestMethod $out.NextPageLink
        $out
    }
}

$items | Export-Excel -Path "C:\temp\azPrices.xlsx" -AutoSize -TableName "AzurePrices"
The goal in this example is to pull all virtual machine reservation pricing from the West US 3 region. Because the API paginates, you must execute multiple queries to get all the data.
If you execute this script in PowerShell, it throws an error.
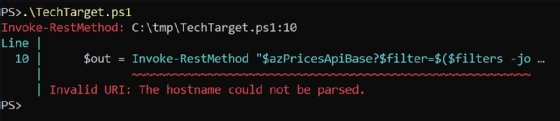
The error suggests that something is wrong with the URL. Open the script in VS Code and start debugging.
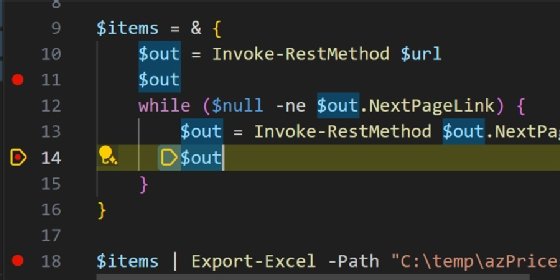
First, put a breakpoint on Line 10 because that is where the error occurs.
Next, start the script in debugging mode. To do this, press F5 on your keyboard, or go to the Run menu and select Start Debugging. When the script gets down to Line 10, it pauses on the breakpoint and highlights the line, as shown in Figure 7.

Then examine the URL variable while the debugger has the script paused. You can see the contents of $url either by typing "$url" into the terminal or by expanding the appropriate scope of variables in the debugger under the Script section and scrolling down to $url, as seen in Figure 8.
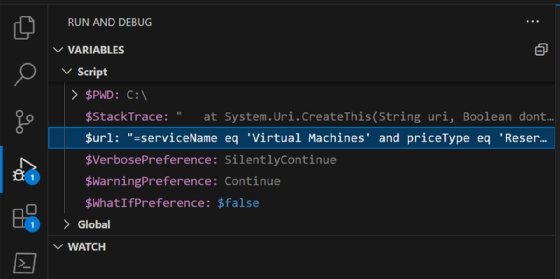
The entire first part of the URL that is present in the $azPricesApiBase variable isn't visible. If you scroll up to that variable or type it into the terminal, you'll find that it does have value, as shown in Figure 9.

Something unexpected occurs on Line 7 where you are building the $url variable.
In this case, there are two problems:
- PowerShell interprets the question mark as part of the variable name. If this happens, you need to escape the question mark.
- The API requires the literal string "$filter" as part of the query parameters. If this happens, you need to escape the dollar sign because the string is within double quotes.
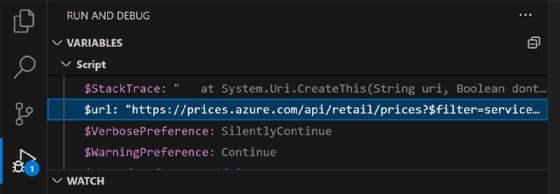
After fixing both issues, Line 7 now looks like this:
$url = "$azPricesApiBase`?`$filter=$($filters -join ' and ')"Next, click the Stop button to stop the debugger.

Then execute the script again to find that the $url looks correct.
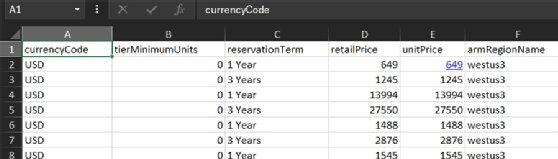
The script runs successfully to completion, except the data that was expected in the spreadsheet is completely different.

Add more break points on Lines 11, 14 and 18 so you can review the data being retrieved.

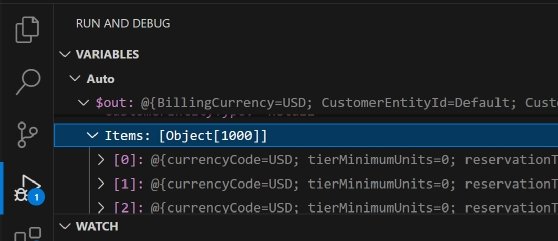
Afterwards, when you execute the script and it stops on Line 11, look at the $out variable. The information you want is in a sub-property named Items.
Track the value of $out. Right click on it and select Watch. It will stay in the Watch section of the debugger pane.
If you want the script to continue, use the debugger controls. The options are Continue, Step Over, Step Into, Step Out and Stop, as seen in Figure 15.

- Continue. Continues to the next break point or the end of the script.
- Step Over. Continues to the next statement in the current execution context.
- Step Into. Continues to the next statement, including nested execution contexts such as function calls.
- Step Out. In a nested execution context, the debugger will proceed until the current execution context is exited.
- Stop. Halts the debugging and exits the debugger.
In this case, click Continue to get to the next breakpoint. Press F5 on the keyboard or the Continue button on the debugger controls, as seen in Figure 16.
On Line 14, the value of $out is similar. It shows the desired output in the Items property. Stop the debugging, and fix Lines 11 and 14 to reference the Items property.
$out.ItemsFinally, remove all the breakpoints and execute the script. The data you expect to see should show up in the spreadsheet.
The importance of variables
It is important to use variables wherever possible to easily debug a code. Variables make it easy to understand what the script executes and how it interacts with cmdlets and functions.
For example, if the script had built the URL in line with the Invoke-RestMethod cmdlet on Line 10, it would have made it more difficult to understand why the URL was incorrect because it would have been present in the debugger. That is what the $url variable defined on Line 7.
Anthony Howell is an IT expert who is well-versed in multiple infrastructure and automation technologies, including PowerShell, DevOps, cloud computing, and the Windows and Linux operating systems.