
maxkabakov - Fotolia
Visual Studio Code vs. the native console for PowerShell debugging
Unsure whether to debug a PowerShell script in Visual Studio Code or the PowerShell console? Follow this tutorial to make the decision a little easier.

In PowerShell, it can be difficult to distinguish between the acts of writing a script and debugging it. To write code in an interpreted language makes it easy for admins to run each step as they write it -- a process that turns into debugging rather quickly.
There are two common options to debug a PowerShell script: the interactive PowerShell console, or one of many PowerShell code editors. For short scripts, the console offers plenty of debugging features, but to debug longer scripts or even modules, use an editor such as Visual Studio Code.
This tutorial walks through examples that further demonstrate when to use the console vs. Visual Studio Code for PowerShell debugging.
When to debug in the console
Let's say we're writing a snippet of code to search the current directory for JSON log files that have the year 2020 in the name and then copy those files to another directory.
Before running a script at the console, set some required variables interactively at the prompt:
$sourceDir = 'C:\tmp\logs'
$targetDir = 'C:\logs'
Then, enter this one-liner (note: since we're running this command interactively, it is acceptable to use aliases, which are command shortcuts or alternate names):
gci $sourceDir -filter *20*.json | %{copy $_.FullName -Destination $targetDir}
After that code executes, we find that it copies files we didn't expect -- particularly, files from last year, even though the filter on the Get-ChildItem cmdlet specifies to look only for files with the year '20' in it.
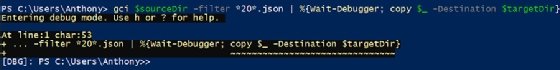
To address this, add a Wait-Debugger command to drop into the debugger:
gci $sourceDir -filter *20*.json | %{Wait-Debugger; copy $_ -Destination $targetDir}
That should produce output similar to below:
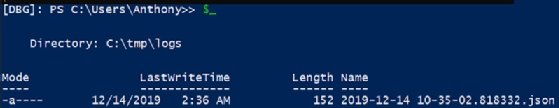
Now you have complete access to the PowerShell debugger. Use $_ to examine the current item in the ForEach-Object loop cmdlet.
As shown below, one file is from 2019, but it still is included because it contains '20':
To verify that, use C to continue onto the next step:

If we were to check the next object, we'd find that it is indeed another 2019 file. So, quit the debugger with q and fix the code to ensure the new directory only has files from the year 2020:
gci $sourceDir -filter 2020*.json | %{copy $_.FullName -Destination $targetDir}
It's possible to make this snippet a little more intelligent -- for example, check the contents of the file to ensure the timestamp inside the log file is also this year. PowerShell does enable admins to write long one-liners, but they can easily become too unwieldy to debug.
It's also possible to write a multiline script interactively in PowerShell. Type in a command and then press Shift-Enter to start a new line. This, however, only offers basic text editing functionality.
For more advanced features, it's best to switch over to Visual Studio Code for PowerShell debugging.
When to debug in VS Code
In our example, the JSON log files contain an array wherein the first item is the date the file was generated. For example:
[
    "2020-01-17 18:05:01.325248",
    {...
Expand the script from the previous section to add a check for that date as well:
$sourceDir = 'C:\tmp\logs'
$targetDir = 'C:\logs'
$files = Get-ChildItem $sourceDir -filter 2020*.json
foreach ($file in $files) {
    $json = Get-Content $file.FullName | ConvertTo-Json
    if ($json[0] -like '2020*') {
        Copy-Item $file.FullName -Destination $targetDir
    }
}
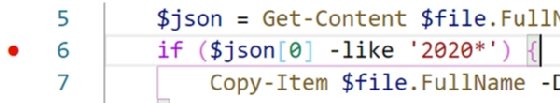
On line six, we see the first item in the converted JSON array. Unfortunately, after running the code, no files show up in the destination directory; it's time for more PowerShell debugging.
Put the cursor on line six and hit F9 on the keyboard to add a breakpoint: When the code hits that line, it will drop into the debugger in the terminal. Notice the red dot to the left of the line:
After the breakpoint is set, press F5 to run the code. Look on the left side as you scroll through the debugger pane, which displays the values of all the variables in the script:
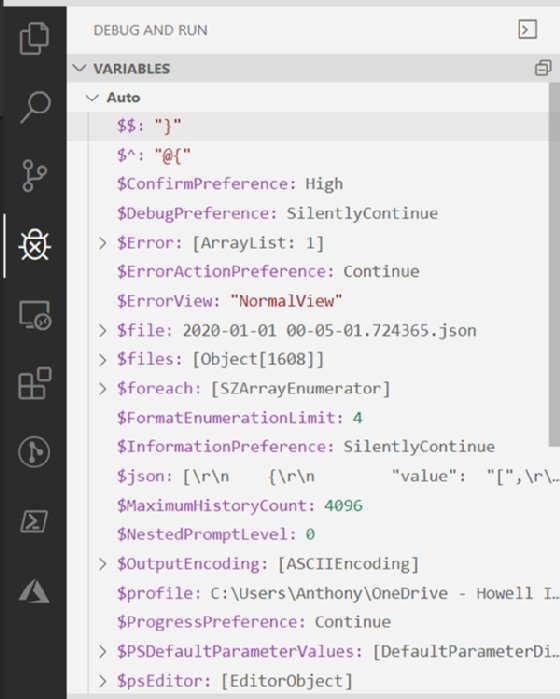
You can see the current $file, the count of objects in the $files array, and even the $json variable. To look at the $json variable in more depth, use the same PowerShell debugging features from the console in the terminal. Enter:
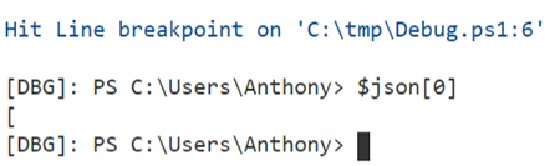
$json[0]
The results, shown below, are not as expected, since the first item in the $json variable is an '[' instead of the date:
To see what type of object $json is, hover your mouse over the variable in the debugger pane, or examine the variable directly. Either way, the results will display a string:
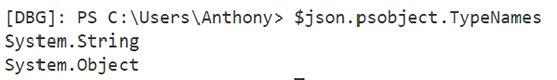
But the ConvertFrom-Json cmdlet should produce an object -- as we intended in this example -- not a string. This is because -- if we look back at the script from the beginning of this section -- we accidentally use ConvertTo-Json instead of ConvertFrom-Json.
The corrected code should look as follows:
$sourceDir = 'D:\UtoData'
$targetDir = 'C:\logs'
$files = Get-ChildItem $sourceDir -filter 2020*.json
foreach ($file in $files) {
    $json = Get-Content $file.FullName | ConvertFrom-Json
    if ($json[0] -like '2020*') {
        Copy-Item $file.FullName -Destination $targetDir
    }
}
Leave the breakpoint on line six, and run the code again with F5 and have another look at that $json variable:
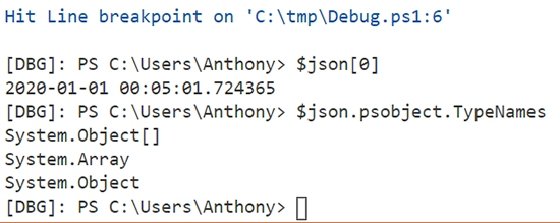
The results now look as expected, as we now have an object instead of a string. This means that ConvertFrom-Json worked. To remove the breakpoint, put the cursor back on line six and hit F9. Now, hit F5 again, and the code will run as intended.