
Maksim Kabakou - Fotolia
Use this Nagios monitoring tutorial for proactive IT monitoring
Learn how to install and run Nagios to monitor your organization's IT assets. Follow these steps so you're prepared to catch problems before they get out of hand.
IT administrators today must be proactive -- rather than reactive -- through aggressive and continuous monitoring of IT infrastructure. It's their job to catch potential issues early, and save businesses from costly extended outages, data loss -- or both.
Nagios, an IT system monitoring tool, enables admins to catch issues before they become full-blown catastrophes. Learn more about the monitoring tool and how to get started with this tutorial, which covers installation and configuration of the following:
- All prerequisite software needed by Nagios Core on a Debian-based Linux server;
- Nagios Core on a Debian-based Linux server and the Nagios server;
- Nagios Remote Plugin Executor (NRPE) on a separate Debian-based Linux server, the Nagios host and the Nagios server; and
- Nagios Plugins on the Nagios host as well as the Nagios server.
We'll run tests for each stage in the process to ensure the example installations and configurations succeeded. By the end, we'll have a Nagios server that's able to monitor a reporting Nagios host.
A brief overview of Nagios
Nagios, released in 2002, is the standard foundation for all present-day infrastructure monitoring systems. While initially designed to run strictly under Linux, Nagios now runs under Unix variants such as FreeBSD, Solaris, Apple OS X and IBM Power.
Nagios comes in two flavors: Nagios Core and Nagios XI. Nagios Core -- the open source version -- is ideal for small- to mid-sized businesses and startups. Nagios XI -- the paid proprietary version -- offers additional features such as graphs, capacity planning and detailed reports. It's a good choice for larger organizations and businesses with strict reporting and auditing requirements, such as financial institutions and companies that deal with HIPAA data.
Nagios handles core metrics such as disk space, network activity, memory and other basic services on servers, as well as specific services and applications such as Secure Socket Shell (SSH), Apache, SMTP, CRM and disaster recovery devices.
IT admins new to Nagios are often unsure which IT components, services and network devices they should monitor in their infrastructure. To prevent feeling overwhelmed, start with mission-critical IT components. With Nagios, IT admins can easily add, modify and remove components.
Nagios project prerequisites
The components required to successfully perform the steps outlined in this Nagios monitoring tutorial are:
- two working Debian-based servers (must have root access);
- internet access; and
- at least a passing familiarity of the Linux command line.
How to install and configure Nagios Core
First, install the Nagios Core server. While Nagios can monitor multiple OSes, the server must reside on a Linux or Unix variant such as FreeBSD or Solaris. In this tutorial, we'll install Nagios on an Ubuntu 19.10 server, but these steps should work on any Debian-based distro.
Next, update the repository cache index and install the Nagios dependencies.
# sudo apt update
# sudo apt install -y build-essential apache2 php openssl perl make php-gd libgd-dev libapache2-mod-php libperl-dev libssl-dev daemon wget apache2-utils unzip
Now, create the nagios user and group, and the nagcmd group. We'll also add the Apache www-data user to the nagios and nagcmd groups.
# sudo useradd nagios
# sudo groupadd nagcmd
# sudo usermod -a -G nagcmd nagios
# sudo usermod -a -G nagios,nagcmd www-data
Download the latest version of Nagios Core, which at the time of publication is version 4.4.5, and extract it.
# cd /tmp
# wget [https://assets.nagios.com/downloads/nagioscore/releases/nagios-4.4.5.tar.gz](https://assets.nagios.com/downloads/nagioscore/releases/nagios-4.4.5.tar.gz)
# tar -zxvf nagios-4.4.5.tar.gz
Then, compile Nagios from source.
# cd /tmp/nagios-4.4.5/
# sudo ./configure --with-nagios-group=nagios --with-command-group=nagcmd --with-httpd_conf=/etc/apache2/sites-enabled/
Once complete, you'll see a configuration summary.
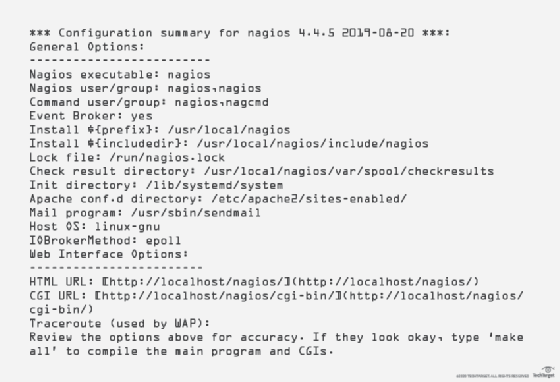
From here, build the Nagios files and install them.
# sudo make all
# sudo make install
Next, install init and the external command configuration files.
# sudo make install-init
# sudo make install-config
# sudo make install-commandmode
# sudo make install-webconf
# sudo /usr/bin/install -c -m 644 sample-config/httpd.conf /etc/apache2/sites-available/nagios.conf
To receive alerts, edit the contacts.cfg file -- /usr/local/nagios/etc/objects/contacts.cfg -- and change nagios@localhost to the desired email address.
define contact {
contact_name nagiosadmin ; Short name of user
use generic-contact ; Inherit default values from generic-contact template (defined above)
alias Nagios Admin ; Full name of user
email nagios@localhost ; <<***** CHANGE THIS TO YOUR EMAIL ADDRESS ******
}
Next, set and verify the nagiosadmin password, which you will use to log into the web interface.
# sudo htpasswd -c /usr/local/nagios/etc/htpasswd.users nagiosadmin
Uncomment the line in /usr/local/nagios/etc/nagios.cfg to enable monitoring of the remote servers.
# cfg_dir=/usr/local/nagios/etc/servers
Then, create a server directory.
# sudo mkdir -p /usr/local/nagios/etc/servers
Use the code below to enable the Nagios server Apache modules.
# sudo a2enmod rewrite
# sudo a2enmod cgi
Restart the Apache server and launch the Nagios Core server.
# service apache2 restart
# service nagios start
Test Nagios
Test the Nagios installation from the command line.
# /usr/local/nagios/bin/nagios -v /usr/local/nagios/etc/nagios.cfg
The output should look similar to the one below.
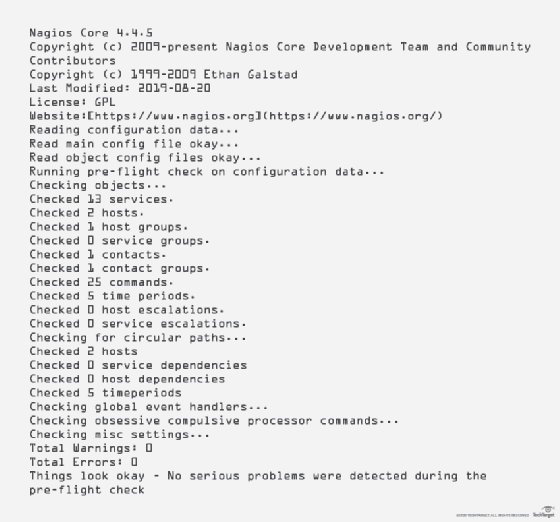
Access the Nagios Core website
Once the Nagios Core server is installed and configured, for basic local monitoring, we can look at the reports.
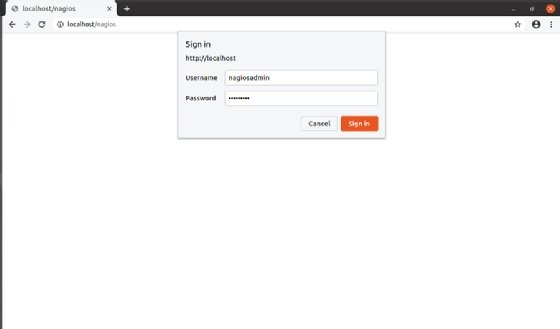
Open the web browser and enter localhost/nagios in the URL bar.
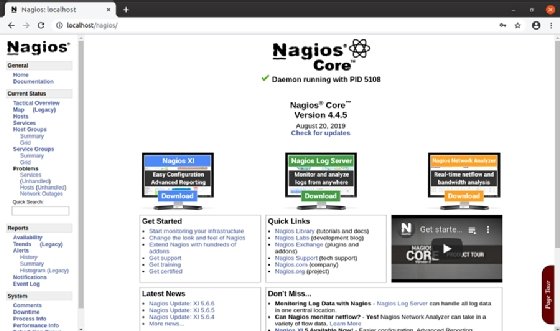
Enter nagiosadmin and the password you created earlier. Click Sign In.
The Nagios Core splash screen will appear. Notice the green check mark in the middle shows Nagios is successfully running, along with the process identification number, or PID. The left-hand frame shows a glimpse of the various options, services and settings that Nagios Core offers.
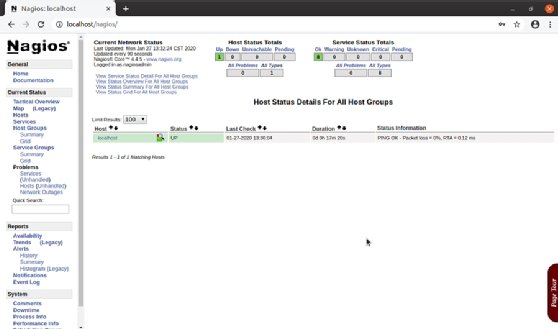
Even though a remote server is not configured, Nagios automatically configures some basic monitors on the Nagios server, our localhost. To take a look, click Hosts from the left frame.
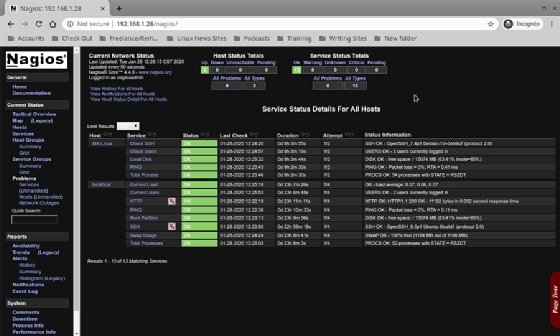
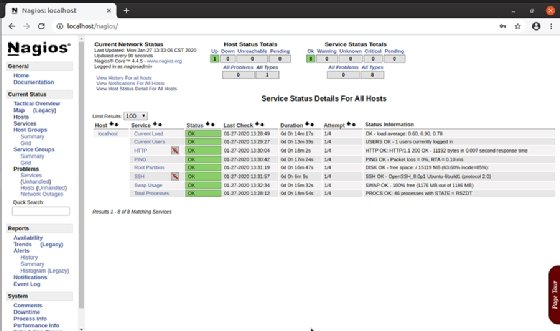
The dashboard shows one host is up and eight services are up and monitored. It also displays the date of the last check, how long the server has been up and some status information. To look at the Services, click on the link in the menu on the left.
Here is the Hosts dashboard, which displays the status details for the eight default services that Nagios Core configured: Current Load, Current Users, HTTP, PING, Root Partition, SSH, Swap Usage and Total Processes. To see more status details for a service, click the actual service link.
Install and configure NRPE
It's crucial that NRPE and Nagios Plugins are installed on all servers and workstations you plan to monitor, including the Nagios server itself. Nagios uses NRPE to execute plugins on remote client systems. The Nagios server receives the results and populates the dashboard.
Let's install NRPE on one of the remote Linux machines. First, download the NRPE source on the remote machine, or host.
#cd /tmp
# sudo wget --no-check-certificate -O nrpe.tar.gz https://github.com/NagiosEnterprises/nrpe/archive/nrpe-3.2.1.tar.gz
# tar xzf nrpe.tar.gz
Next, compile the source code.
# cd /tmp/nrpe-nrpe-3.2.1/
# sudo ./configure --enable-command-args --with-ssl-lib=/usr/lib/x86_64-linux-gnu/
After the NRPE source code compiles successfully, you'll see a configuration summary.
*** Configuration summary for nrpe 3.2.1 2017-09-01 ***:

General Options:
-------------------------
NRPE port: 5666
NRPE user: nagios
NRPE group: nagios
Nagios user: nagios
Nagios group: nagios

Review the options above for accuracy. If they look okay,
type 'make all' to compile the NRPE daemon and client
or type 'make' to get a list of make options.
Then, finish the compile, create the groups and users, and install the binaries and configuration files.
# sudo make all
# sudo make install-groups-users
# sudo make install
# sudo make install-config
Next, update the services file so Nagios and any related components translate service names to a port number. In this case, 5666.
# sudo sh -c "echo >> /etc/services"
# sudo sh -c "sudo echo '# Nagios services' >> /etc/services"
# sudo sh -c "sudo echo 'nrpe 5666/tcp' >> /etc/services"
Install the service/daemon.
# sudo make install-init
# sudo systemctl enable nrpe.service
Then, tweak the NRPE configuration file -- /usr/local/nagios/etc/nrpe.cfg -- on the host. Specifically, ensure that you add the server IP address after 127.0.0.1 to the line.
allowed_hosts=127.0.0.1,10.25.5.2
If there is more than one Nagios server, enter the IP addresses for each one. Use a comma as a separator.
Next, we want the value in dont_blame_nrpe=0 changed to dont_blame_nrpe=1.
This change enables clients to specify arguments to commands, which in turn enables more advanced NRPE configurations.
And for our final edit to /etc/nagios/nrpe.cfg, ensure that the following commands are uncommented.
command[check_users]=/usr/lib/nagios/plugins/check_users -w 5 -c 10
command[check_load]=/usr/lib/nagios/plugins/check_load -w 15,10,5 -c 30,25,20
command[check_hda1]=/usr/lib/nagios/plugins/check_disk -w 20% -c 10% -p /dev/hda1
command[check_zombie_procs]=/usr/lib/nagios/plugins/check_procs -w 5 -c 10 -s Z
command[check_total_procs]=/usr/lib/nagios/plugins/check_procs -w 150 -c 200
Plugins use these commands to help monitor basic services such as number of users logged in, system load, root file system usage, swap usage and process number total.
Finally, start the NRPE daemon.
# sudo /etc/init.d/nagios-nrpe-server start
Install and configure the Nagios Plugins
NRPE will not work properly without the Nagios Plugins. Download the Nagios Plugin source to the host and extract our tarball.
# cd /tmp
# sudo wget --no-check-certificate -O nagios-plugins.tar.gz https://github.com/nagios-plugins/nagios-plugins/releases/download/release-2.3.1/nagios-plugins-2.3.1.tar.gz
# sudo tar -zxvf /tmp/nagios-plugins-2.3.1.tar.gz
Next, compile the source code and install the binaries and configuration files.
# cd /tmp/nagios-plugins-2.3.1/
# sudo ./configure --with-nagios-user=nagios --with-nagios-group=nagios
# sudo make
# sudo make install
Note that while the Nagios Plugin package we just installed contains most of the plugins, there are some plugins that require other libraries not included. To install those, see the Nagios website.
Monitoring your Linux host
Once the Nagios server and NRPE are installed, make the host visible to the Nagios server and include the services you wish to monitor. To accomplish this, create host configuration files in the /usr/local/nagios/etc/servers directory on the Nagios server.
The host configuration file defines the host, along with the defined services you wish to monitor on the host machine, such as PING.
A single file can contain all the hosts and services, but it's not recommended. Instead, use separate files for each host you wish to monitor, along with specific definitions of the services you want to monitor on that host. For the Nagios server to monitor the host and the services defined in the file, there must be a file extension of .cfg so the monitoring tool can recognize the host configuration file. A common practice is to name the file the same as the server name, plus the cfg extension -- for example, debian-server.cfg.
To get you started, a sample host file is included. Cut and paste the sample and save it to a template file in /usr/local/nagios/etc/servers to use as a template for host configuration files.
# Nagios Host configuration file template
define host {
        use                          linux-server
        host_name                    mtr-ubuntu
        alias                        Ubuntu Host
        address                      192.168.1.6
        register                     1
}

define service {
      host_name                       mtr-ubuntu
      service_description             PING
      check_command                   check_ping!100.0,20%!500.0,60%
      max_check_attempts              2
      check_interval                  2
      retry_interval                  2
      check_period                    24x7
      check_freshness                 1
      contact_groups                  admins
      notification_interval           2
      notification_period             24x7
      notifications_enabled           1
      register                        1
}

define service {
      host_name                       mtr-ubuntu
      service_description             Check Users
      check_command           check_local_users!20!50
      max_check_attempts              2
      check_interval                  2
      retry_interval                  2
      check_period                    24x7
      check_freshness                 1
      contact_groups                  admins
      notification_interval           2
      notification_period             24x7
      notifications_enabled           1
      register                        1
}

define service {
      host_name                       mtr-ubuntu
      service_description             Local Disk
      check_command                   check_local_disk!20%!10%!/
      max_check_attempts              2
      check_interval                  2
      retry_interval                  2
      check_period                    24x7
      check_freshness                 1
      contact_groups                  admins
      notification_interval           2
      notification_period             24x7
      notifications_enabled           1
      register                        1
}

define service {
      host_name                       mtr-ubuntu
      service_description             Check SSH
      check_command                   check_ssh
      max_check_attempts              2
      check_interval                  2
      retry_interval                  2
      check_period                    24x7
      check_freshness                 1
      contact_groups                  admins
      notification_interval           2
      notification_period             24x7
      notifications_enabled           1
      register                        1
}

define service {
      host_name                       mtr-ubuntu
      service_description             Total Process
      check_command                   check_local_procs!250!400!RSZDT
      max_check_attempts              2
      check_interval                  2
      retry_interval                  2
      check_period                    24x7
      check_freshness                 1
      contact_groups                  admins
      notification_interval           2
      notification_period             24x7
      notifications_enabled           1
      register                        1
}
IT administrators will find a treasure trove of sample host check_commands in /usr/local/nagios/etc/objects/commands.cfg to use as examples of how to add more services.
Once the first host configuration file is complete, check for mistakes.
# /usr/local/nagios/bin/nagios -v /usr/local/nagios/etc/nagios.cfg
If there is a mistake in the hosts config file, Nagios will return an error.
Now, restart all services. On the remote machine (host), restart the NRPE service.
# sudo /etc/init.d/nagios-nrpe-server start
On the Nagios server, restart both Apache and Nagios.
# sudo service apache2 restart
# sudo service nagios restart
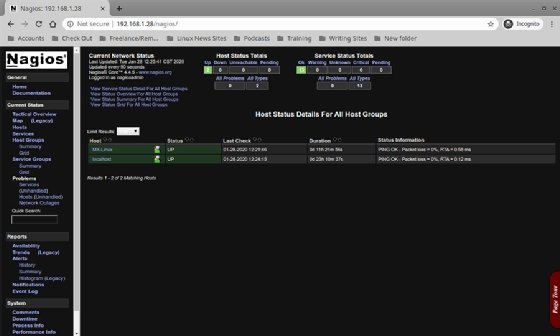
To test the tool, open a web browser and enter /host.
Note that the remote server now shows on the dashboard along with the Nagios server (localhost).
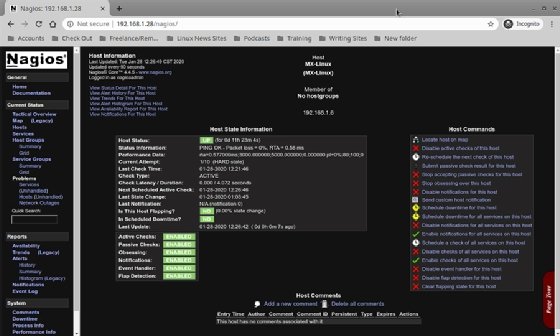
See that both the monitored servers are up, as are all services.
Note the dashboard for the remote host and the detailed information provided.
The newly built Nagios server can also monitor Windows Servers, and the Nagios website offers more Nagios Plugins, or IT admins can even write their own.


