
Getty Images/iStockphoto
Citrix Virtual Apps and Desktops basic troubleshooting guide
Without the proper troubleshooting process, IT would have to guess what the issue might be. However, a clear and consistent approach can provide fast and accurate results.

Issues with Citrix Virtual Apps and Desktops can harm operation efficiency and hinder an organization's ability to achieve its goals, so troubleshooting any problems is critical for IT.
Significant issues such as a Citrix outage mean that users can't do their work. For remote workers that can't drive to the office and sign in locally, Citrix is their only avenue to accessing business resources, apps and data.
Even minor Citrix issues can lead to a bad user experience, and latency will make end users less productive, hurting the organization's output and efficiency. As a Citrix administrator, the first steps you should take when troubleshooting Citrix Virtual Apps and Desktops on premises and with Citrix Cloud should be to ensure that the service is available.
What to do when Citrix Virtual Apps and Desktops is not available
You should start the Citrix troubleshooting process with the most prominent issue end users might face: Citrix Virtual Apps and Desktops is unavailable. Imagine that you receive the calls from the helpdesk that end users cannot sign into their Citrix sessions.
On-premises troubleshooting steps
If you run Citrix Virtual Apps and Desktops on premises, take the following steps:
1. First, check that the Citrix application delivery controller (ADC), or Netscaler, and the virtual servers on the ADC are up and functioning properly. Sign in to your ADC and click on Citrix Gateway, then Virtual Servers. Here, you can see if your virtual server is up and the status of the secure ticket authorities (Figure 1).

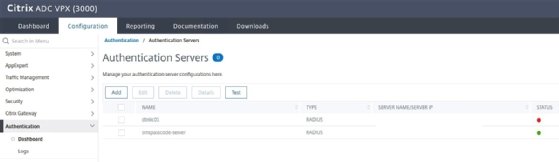
The next step on the Citrix ADC is to check if authentication is working correctly. You should click on Authentication and then Dashboard. Here we can see the authentication servers and the status of the servers. If these servers have a red dot, as the drnlic01 server does here, you should research the logs section to find the root cause (Figure 2).
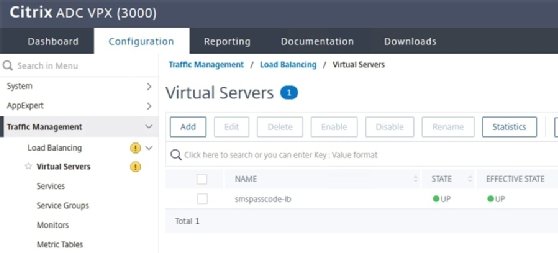
The final aspect to check on with the Citrix ADC is the load-balanced virtual servers. First, you should click on Traffic Management.
Then, select Load Balancing, followed by Virtual Servers. Once you are on this dashboard, you can check if all load-balanced servers are up. In this example, there are no issues with the servers (Figure 3).
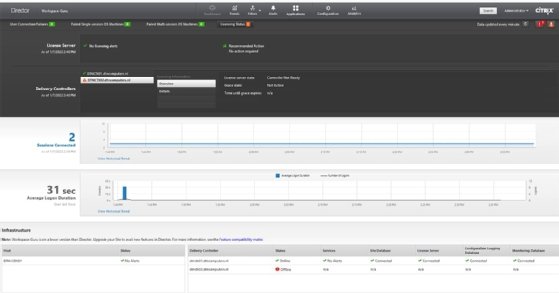
2. After checking the Citrix ADC for any issues, you need to check the Citrix Virtual Apps and Desktops environment. You can do this with Citrix Director, the built-in monitoring and troubleshooting tool for Citrix Virtual Apps and Desktops environments. After you open Director and sign in, you can check the status of your VDI environment directly with a variety of methods.
In this example, one of the delivery controllers is down (Figure 4).
Another option within the infrastructure section is to investigate if there is something wrong with your hosting connection and delivery controllers. When Director detects workloads that aren't functioning properly, it provides warning notifications at the top of the interface.
3. The next thing you should check is licensing. While you can see this information in Director, there is more detailed information in Citrix Studio. Find this by navigating to Configuration and then Licensing.
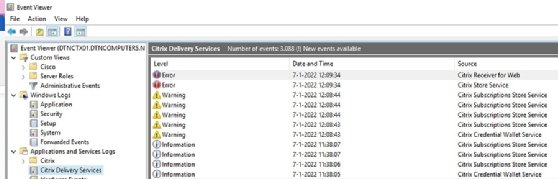
4. After that, you should check the event log of the Citrix Storefront. The Storefront services are not included with the infrastructure monitoring of Director. Often, issues with the credential wallet or DNS issues may arise.
These issues will show up in the Storefront event log. You can find the event log of the storefront in the event viewer on your storefront server. Go to Applications and Services Logs and then select Citrix Delivery Services. This will take you to the errors in the log (Figure 5).
If you have multiple storefront servers, don't forget to check all the server event logs.
5. The next step you should take is to see if your machines are registered correctly with the Citrix Delivery Controller. If machines are not correctly registered, they should be visible in Citrix Director -- see step 2. In Citrix Studio, you can double-check these machines by clicking on Search. Make sure the search field is empty, as this will show all single-session multi-session machines and the sessions. They are spread in three tabs, showing the registration state of the machines (Figure 6).
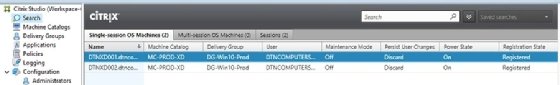
If a machine is not registered properly, you can use the Citrix Health Assistant to troubleshoot why the machines are not registered. This tool is available on the Citrix website.
Troubleshooting steps for a Citrix Cloud environment
If you are a Citrix Cloud customer and use Citrix Virtual Apps and Desktops services, there are slightly different steps to take.
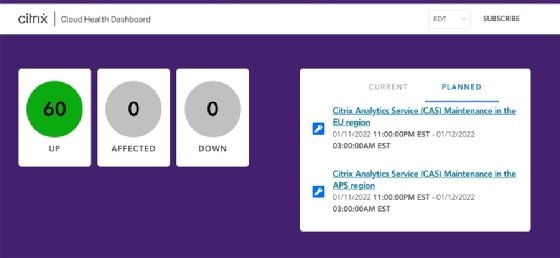
1. Go to the Citrix Cloud Health Dashboard website and check if all services of Citrix Cloud are up and functioning. Outages or scheduled maintenance could pop up and affect end users' ability to access their workstations. It may be a good idea to click on the subscribe button in the top right corner, ensuring that you get automatic emails when there are outages or maintenance (Figure 7).
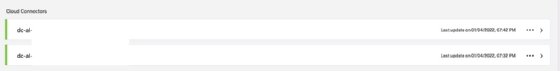
2. If everything is green on the health site and there are no outages, check your Cloud Connectors' health. Sign in to the Citrix Cloud portal, click on the three lines in the top left corner and select Resource Locations.
Here you will see all your machines. Click on the Cloud Connectors. You should be able to see the status of your Cloud Connectors. If all your Cloud Connectors have a green line on the far left, they are running properly, and the connection is established with Citrix Cloud (Figure 8).
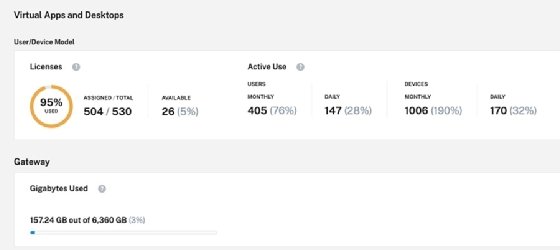
3. Check if there are enough licenses available in Citrix Cloud. Click on the same menu with the three horizontal lines in the top left corner, and this time select Licensing.
Here you can see if enough licenses are available for your users to sign into their Citrix environment (Figure 9).
4. The final step you should check is to see if all the machines have registered correctly with Citrix Virtual Apps and Desktops services. Click the top left menu, select My Services, and click on Virtual Apps and Desktops from the services dropdown.
From here, you can click on Monitor, and you will be able to see if there are machines not registered or that have failed to boot (Figure 10).

5. If everything you checked here is in the green and up, there might be an issue with the Citrix Cloud back end. You should create a ticket with Citrix Support marked as the highest priority.
How to address poor UX in Citrix Virtual Apps and Desktops
Once you've established that the availability of the Citrix environment isn't the root cause of the issue, the next step is to investigate another common problem: poor UX. A negative user experience can come from numerous causes, but some of the regular offenders are a bad internet connection and not enough performance on the host. To dig up more information on Citrix UX, the following are the first steps you should take:
1. In Citrix Cloud, click on the menu icon in the top left corner and select Virtual Apps and Desktops Services, followed by Monitor. In an on-premises environment, start Citrix Director and sign in. The following steps are the same for Citrix Cloud and Citrix on premises.
2. At the top of Director, click on the Search button and search for the user session you want to troubleshoot.
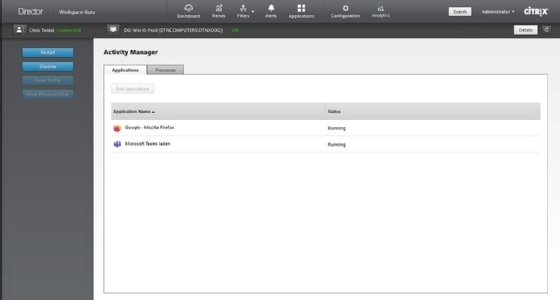
3. From the User Overview, you can directly see which applications and processes the user has started. You can see if applications are hanging and even choose to end applications. There are buttons on the left side of the console to restart the VDI or shadow the end user (Figure 11).
4. Click on Details in the top right corner. Here you will see information about the machine the end user is working on and the session details. You can check various details here, such as the following:
- Citrix Workspace App Version. The takeaway from this should be whether or not the end user has the latest version of the app.
- ICA RTT and ICA Latency. High latency numbers can indicate that the end user might have a bad connection to the Citrix environment due to a weak Wi-Fi connection or a broken cable.
- disk sec/transfer and Current disk queue length. A high number can indicate performance issues with your Citrix host (Figure 12).
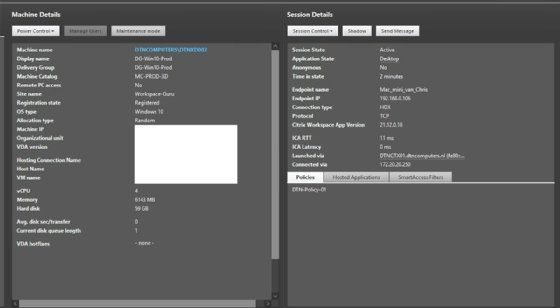
You can click on the machine name in blue and get details about CPU, Memory, IOPS and other virtual resource consumption to get an even more detailed look into that machine's performance.
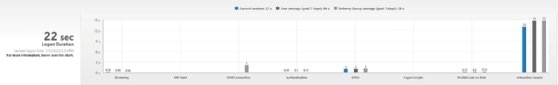
5. When you scroll down, you can see the exact logon of your end-user session. This can help the troubleshooting process for slow logins (Figure 13).
Tools for troubleshooting Citrix issues
The tools from these steps are included with Citrix Virtual Apps and Desktops as services, but plenty of other tools can troubleshoot Citrix environments. A mature market of virtual desktop monitoring tools can help Citrix administrators.
For example, performance monitoring tools from vendors such as ControlUp, Liquidware, EG Innovations, Login VSI, and RDAnalyzer can help administrators troubleshoot with a broad range of features. To get the most insight into your environment, consider researching these tools via their websites, talking to vendor representatives and even requesting a demo. The more insight you can create in the environment, the more the UX will improve because IT can catch issues before they come to fruition as latency or other problems.