
Getty Images
Avoid VM latency issues with VMware NUMA Observer
NUMA Observer from VMware Labs helps admins identify VMs that have overlapping NUMA nodes and storage problems. Learn how the setup process can identify VM issues.

Engineers at VMware Flings developed the NUMA Observer tool to find and address scheduling problems. The tool looks at vSphere inventory to identify VMs that are on the same host and scheduled to run on the same processor. The tool also collects remote memory data and can send alerts about CPU starvation and critical VM memory use.
The NUMA Observer only checks for VMs where admins configure the CPU affinity; the default setup runs VMs on the same processor, though not simultaneously -- that's what the CPU scheduler addresses.
For companies that run large virtual workloads, it is essential to reduce latency and provide VMs with enough resources. Virtualization admins can schedule VM affinity to non-uniform memory access (NUMA) nodes that combine CPU and RAM. But inefficient scheduling, migrations and failover can lead to performance issues that are tough to detect. With NUMA Observer, admins now have a tool to make this detection process easier.
The benefits of NUMA for VMs
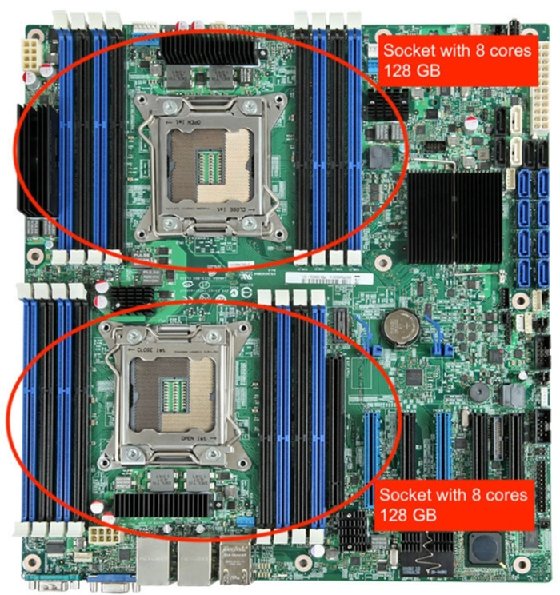
There are multiple CPU sockets on the motherboard of each CPU -- which has multiple cores -- that can directly access a portion of the server's memory. When hardware accesses other CPU-accessible memory locations on the host through an interconnect bus, it can cause memory access latency. The image below shows a two-socket system. If the host has 256 GB of RAM, then each CPU can directly access 128 GB.
CPU-based processes can access all host memory. It's not efficient to access memory that belongs to another CPU because the memory access path is longer and slower. This memory access workflow can pose issues because VMs also run CPU-based processes.
If a VM runs inside a NUMA node and uses the memory that is directly accessible by the CPU, it reduces potential performance issues.
For example, if a VM with 192 GB of memory uses RAM from another CPU, connects to the CPU's memory and faces latency to gain remote memory access, then performance issues could occur. Virtual NUMA prevents possible latency because it reflects the NUMA architecture inside the VM and enables the guest OS to optimize memory scheduling.
Current servers have more cores per CPU and lots of memory, so for most VMs, just a few cores and 16 GB of RAM is enough to avoid scheduling problems; they can fit in a NUMA node and don't have to span CPUs and memory.
There are use cases that require large amounts of CPU capacity and memory, however. With dozens of virtual CPUs and hundreds of gigabytes of memory assigned to a VM, there's a possibility a VM can't run in one NUMA node and requires advanced VM resource scheduling.
Admins can schedule VMs to run on certain NUMA nodes. When a cluster is implemented with large nodes to accommodate these large VMs, it's possible to get the VMs in the correct, optimized layout across hosts.
When admins migrate VMs to other hosts -- or when a failover occurs due to ESXi server failure -- they change the infrastructure layout. VMs with overlapping NUMA node assignments can cause scheduling collisions that lead to serious performance penalties.
Install and run NUMA Observer
VMware's NUMA Observer is available for download from the VMware Flings website. To run the tool, extract the zip file and run it with a Java command.
The NUMA Observer utility is written in Java, so the only system requirement is Java version 8. After admins download the tool, they can run it with the java -jar <path-to-jar-file> command.
The following image details the program's execution with the optional -sslNoVerify parameter. This parameter is used because the vCenter server test setup uses a self-signed certificate and admins should bypass the certificate checking step.

After the tool launches, open a browser on the same computer and access it at https://localhost:8443. The next image shows the login screen. Authentication is required to run either a vCenter server or an individual ESXi host.
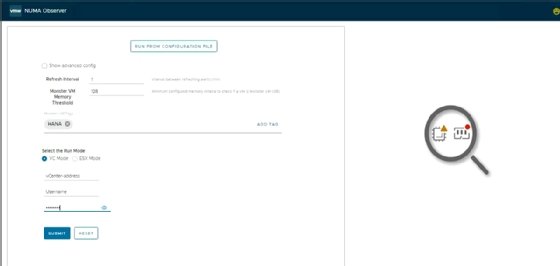
The startup screen includes advanced setting configuration options. This example has a configuration with 128 GB of RAM, which makes it a large VM; test environments typically don't run VMs with that amount of RAM.
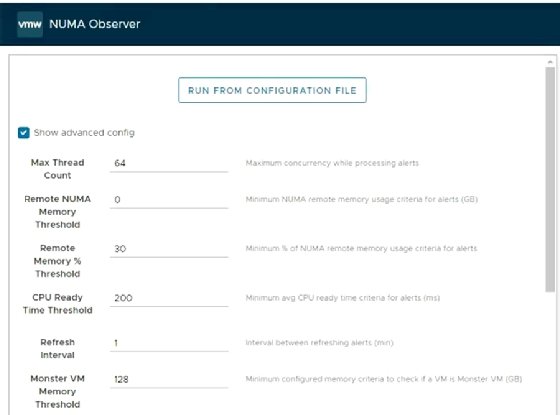
After login, the main screen enables admins to start a manual check for VM processor overlap or to schedule the process to automatically run. The interval to scan for overlaps is an advanced option that admins can configure before login; the default time interval is 1 minute.
The next image shows that there are four VMs on the same host and all of them are scheduled to run on CPU 0 and 1. This is the exact scheduling conflict the NUMA Observer looks for.
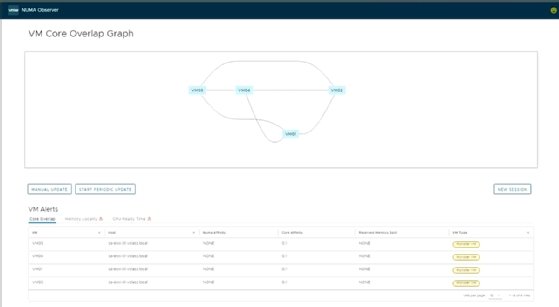
To fix this scenario, move the VMs to other hosts so they can each run on their own CPU on their own host. With NUMA Observer, admins now have a tool to find process scheduling conflicts to prevent performance problems with large VMs.