development environment

What is a development environment?
In software, web and mobile application development, the development environment is a workspace with a set of processes and programming tools used to develop the source code for an application or software product. Development environments enable developers to create and innovate without breaking something in a live environment.
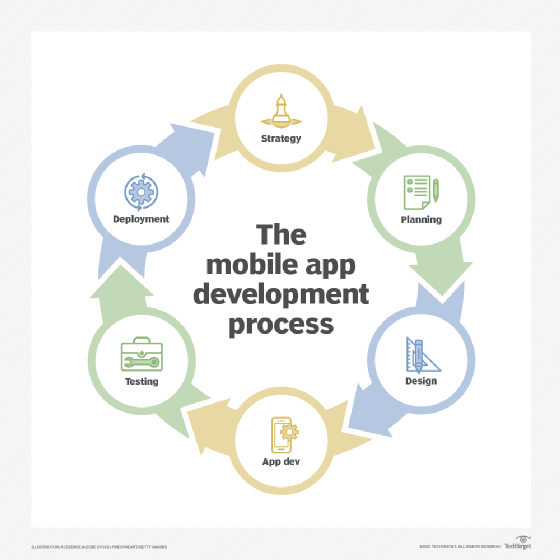
Mobile and web application development environments have roots in traditional software development environments. So, although the three development environments have some similarities, they have inherent differences. Delivered over the internet and through a browser, web applications commonly have a short development cycle led by small teams; meanwhile, mobile apps are often written specifically to take advantage of the unique features of a particular mobile device and even an operating system (OS).
Types of development environments
Common types of development environments include the following:
- Language-centered environments support one programming language and related tools.
- Structure-oriented environments enable developers to manipulate structures directly.
- Toolkit environments offer a collection of tools, including language-independent support, configuration management and version control.
The development environment enables the automation of manual processes involved in developing, testing, debugging, patching, updating and maintaining the application. As part of a tiered structure of environments, any changes made in the development environment are implemented through various environments before the code is live. The development environment includes local development, staging and a live environment. Together, the entire ecosystem supports the process from end to end.
However, the development environment often supports three server tiers: development, staging and production, often referred to as the DSP.
1. Development server
The development server is used to test the code and conduct application performance checks. Once successfully tested, the developer moves the application to the staging server.
2. Staging server
The staging server looks exactly like the production server environment. Using a staging server enables developers to run tests on the staging server to ensure reliability and avert failure in an actual production server. Running tests on the staging server is usually the final step before deploying the application to a production server.
3. Production server
A production server or live server is used to host website content and applications for deployment to a live environment. Once the application is approved, it becomes part of the production server.
What is an integrated development environment?
An integrated development environment (IDE) is one in which the processes and tools are coordinated to provide developers an orderly interface and a convenient view of the development process -- or, at least, the processes of writing, testing and packaging code for use. IDEs, which can be compared to a software development tool belt, help maximize developer productivity and efficiency.
An example of an IDE product is Microsoft's Visual Studio .NET. The term computer-aided software engineering refers to a set of tools and practices that facilitates the management of a software development project.
Types of integrated development environments
The type of IDE used should correspond with the type of application being developed. So, IDEs should match the language or languages supported, the devices and OSes used, whether they are in the cloud -- including as-a-service applications -- or other factors.
Cloud IDEs are web-based integrated development environments. In addition to being cloud-based, cloud IDEs are designed for developing cloud apps. Some cloud IDEs are optimized for creating native apps for smartphones, tablets and other mobile devices. Cloud IDEs are accessible from any location from any compatible device; require little to no downloading and installation; and enable easy collaboration among geographically dispersed developers.
An IDE for mobile development typically works with code that runs on iOS or Android devices. Cross-platform support may be a significant factor for IDEs, particularly when it comes to mobile application development. For instance, if an application is intended for use on iOS, Android and a webpage, starting with an IDE that offers cross-platform support for different OSes would be advisable.
Another type of integrated development environment is a Java IDE. Although this is an IDE for programming in Java, this type of IDE might provide functionality in other languages.
The Arduino integrated development environment is another type of IDE. The Arduino IDE is an open source IDE that enables developers to write, compile, test and upload code to any Arduino board. It is like a notepad or text editor with different functions and features.
See also: low-code, no-code, web application development, iterative development, artifact, software development kit, Agile software development, behavior-driven development and Lean software development.