How Morgan Stanley scaled up Tableau self-service analytics
Morgan Stanley wanted to empower users to make data-driven decisions. A Tableau analytics platform was the answer. The problem: introducing it to 30,000 users.
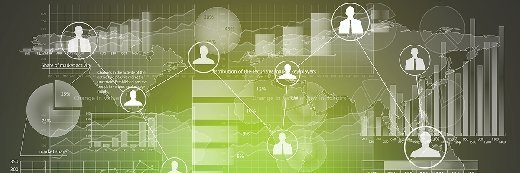
Financial services company Morgan Stanley is adjusting its business models to market realities and using self-service analytics tools to fuel a huge part of its business. The company is using visual analytics, combined with a rigorous set of standards and robust data architecture, to push out a self-service analytics platform for its wealth management division.
According to Jeff Clendening, vice president of analytics and data at Morgan Stanley Wealth Management, the company's Tableau self-service analytics installation has enabled business analysts to create new reports and visualizations on the fly. Morgan Stanley can also push out experimentation with data to line-of-business leaders, branch managers and tens of thousands of individual financial advisers scattered across the country.
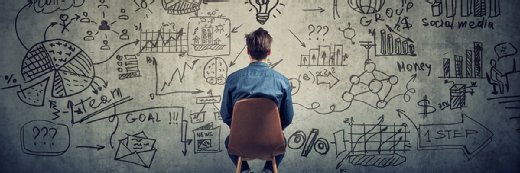
"We want to make more accurate, faster decisions [and] make them less manpower-intensive. We want to create a culture of decentralized analytics," Clendening explained during a session at last month's Tableau Conference 2018. "We thought, 'Wouldn't it be great if every analyst within the firm was able to use that date, use the platform, use access to data and be able to derive their own insight?' These are the people closest to their data; these are the people who are going to get the best insights from it."
How Morgan Stanley selected Tableau
The company's journey to Tableau self-service analytics began four years ago. A select number of data analytics team members were experimenting with ways to streamline how Morgan Stanley tapped into the vast wealth of data it had in various systems.
"We need to create feedback loops. We need the ability to fail fast," Clendening said. "Visualization needs to provide this. We need the ability to all look at it to know quickly if something is working, to keep investing; if it's not, to take that capital and deploy it somewhere else."
As the team members tinkered with Tableau, they realized it could be used to great effect to spearhead a self-service data analytics program.
We need the ability to all look at [visualizations] to know quickly if something is working, to keep investing; if it's not, to take that capital and deploy it somewhere else.
Jeff Clendeningvice president of analytics and data at Morgan Stanley Wealth Management
The basic idea was to link the Tableau self-service analytics platform to important data stores, with governance built in from the outset. Morgan Stanley put the data into the hands of business users and let them experiment with how to slice and dice data in meaningful ways. The business users then quickly prove out use cases for certain types of analytical modeling or visualizations -- when they find a winner, it's time to escalate. These self-published visualizations can then be kicked over to IT, which can optimize them and strengthen them for pushing them out at scale within organizationwide applications.
"Our platform provides a way for business users to do it themselves by building the visualization, publishing it in a controlled way, getting it approved and then engaging with IT to roll it out to everyone," said Ram Jois, executive director of enterprise information management at Morgan Stanley Wealth Management.
Key to making it happen was not only picking a user-friendly tool, but also developing a center of enablement to create the processes and sense of community to get users engaged, trained and using the platform.
"The core goal with the center of enablement was to drive as deep into the organization as possible, while at the same time providing a coordinated training, governance and quality-control function to ensure that all the output is accurate and consistent," Clendening said.
From 600 to 30,000 self-service analytics users
Once the analytics team learned the system, Morgan Stanley began scaling up the Tableau self-service analytics platform with power users in 2016. This was a community of more than 600 business analyst users -- the ones with the most experience working with the widest range of data. Those users were encouraged through formalized training, gamification that incentivized training and experimentation, and competitions for developing visualizations based on certain sets of data.
Once the power users were fully engaged, the company moved on to 3,000 branch managers and line-of-business leaders in 2017, embedding Tableau into their dashboards and training them up on ways to experiment with the data. In 2018, that program has been expanded out to 30,000 users, including 15,000 financial advisers -- the visualization self-publishing capability is built into their main application.
The self-service analytics tools are yielding very real benefits for Morgan Stanley and its financial advisers. One of the most heavily touted new features marketed to wealth management -- next-best action -- is directly derived from the self-service model that has sprung up in just the past several years. Clendening said Morgan Stanley hopes to continue this trend as data is further democratized out to the bounds of its organization.