Excel
What is Excel?
Excel is a spreadsheet program from Microsoft and a component of its Office product group for business applications. Microsoft Excel enables users to format, organize and calculate data in a spreadsheet.
By organizing data using software like Excel, data analysts and other users can make information easier to view as data is added or changed. Excel contains a large number of boxes called cells that are ordered in rows and columns. Data is placed in these cells.
Excel is a part of the Microsoft Office and Office 365 suites and is compatible with other applications in the Office suite. The spreadsheet software is available for Windows, macOS, Android and iOS platforms.
Common Excel use cases
Excel is most commonly used in business settings. For example, it is used in business analysis, human resource management, operations management and performance reporting. Excel uses a large collection of cells formatted to organize and manipulate data and solve mathematical functions. Users can arrange data in the spreadsheet using graphing tools, pivot tables and formulas. The spreadsheet application also has a macro programming language called Visual Basic for Applications.
Organizations use Microsoft Excel for the following:
- collection and verification of business data;
- business analysis;
- data entry and storage;
- data analysis;
- performance reporting;
- strategic analysis;
- accounting and budgeting;
- administrative and managerial management;
- account management;
- project management; and
- office administration.
Excel terminology and components
Excel has its own terminology for its components, which new users may not immediately find understandable. Some of these terms and components include the following:
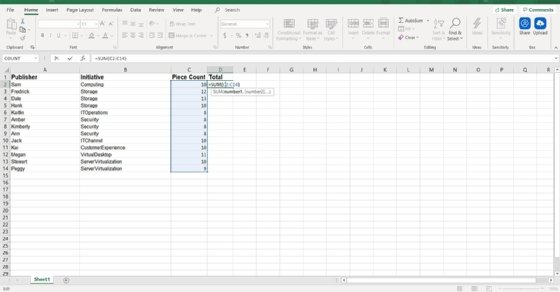
- Cell. A user enters data into a cell, which is the intersection of a column and row.
- Cell reference. This is the set of coordinates where a cell is located. Rows are horizontal and numbered whereas columns are vertical and assigned a letter.
- Active cell. This is the currently selected cell, outlined by a green box.
- Workbook. This is an Excel file that contains one or more worksheets.
- Worksheet. These are the different documents nested within a Workbook.
- Worksheet tab. These are the tabs at the bottom left of the spreadsheet.
- Column and row headings. These are the numbered and lettered cells located just outside of the columns and rows. Selecting a header highlights the entire row or column.
- Formula. Formulas are mathematical equations, cell references or functions that can be placed inside a cell to produce a value. Formulas must start with an equal "=" sign.
- Formula bar. This is the long input bar that is used to enter values or formulas in cells. It is located at the top of the worksheet, next to the "fx" label.
- Address bar. This bar located to the left of the formula bar shows the number and letter coordinates of an active cell.
- Filter. These are rules a user can employ to select what rows in a worksheet to display. This option is located on the top right of the home bar under "Sort & Filter." An auto filter option can be selected to show rows that match specific values.
- AutoFill. This feature enables users to copy data to more than one cell automatically. With two or more cells in a series, a user can select both cells and drag the bottom right corner down to autofill the rest of the cells.
- AutoSum. This feature enables users to add multiple values. Users can select the cells they want to add and press the Alt and Equal keys. There is also a button to enable this feature on the top right of the home page, above "Fill" and to the left of "Sort & Filter."
- PivotTable. This data summarization tool sorts and calculates data automatically. This is located under the insert tab on the far left.
- PivotChart. This chart acts as a visual aid to the PivotTable, providing graph representations of the data. It is located under the middle of the insert page, next to maps.
- Source data. This is the information that is used to create a PivotTable.

Advanced Excel capabilities
More advanced tools in Excel include the following:
- TREND function. This tool is used to calculate linear trend lines through a set of Y or X values. It can be used for time series trend analysis or projecting future trends. Trendlines can be used on charts.
- VLOOKUP. The Vertical Lookup, or VLOOKUP function, can be used to search for values in a larger data set and pull that data into a new table. VLOOKUP is a cell input command that looks like =VLOOKUP(). The parentheses include the data the user wants to look up, where to look for it, the column number with the value to return; or optionally, the user can specify an Approximate or Exact match indicated by True or False.
- Table Array. This is a combination of two or more tables with data and values linked and related to one another. This is part of VLOOKUP.
- Col_index_num. Another value when creating a table array that specifies the column from where data is being pulled.
- Range_lookup. This value in VLOOKUP provides information closest to what a user wants to find when nothing matches other variables. This is represented by a true or false label. False gives the exact value a user is looking for and True gives results from a variable data range.
- MAX and MIN functions. These functions provide the maximum and minimum values from selected data sets. MAX is used to find the maximum value in a function tab and MIN is used to find the minimum value.
- AND function. This function has more than one criteria set when searching variables. If a variable matches the criteria, the value will be returned as true; if not, it will be returned as false. The input for the function should look like this: =AND (logical1, [logical2], ...).
Additional functions for use in Excel include subtract, multiply, divide, count, median, concatenate and other logical functions similar to AND, such as OR.
Excel and XLS files
An XLS file is a spreadsheet file that can be created by Excel or other spreadsheet programs. The file type represents an Excel Binary File format. An XLS file stores data as binary streams -- a compound file. Streams and substreams in the file contain information about the content and structure of an Excel workbook.
Versions of Excel after Excel 2007 use XLSX files by default, since it is a more open and structured format. Later versions of Excel still support the creation and reading of XLS files, however. Workbook data can also be exported in formats including PDF, TXT, Hypertext markup language, XPS and XLSX.
Macro-enabled Excel files use the XLSM file extension. In this case, macros are sets of instructions that automate Excel processes. XLSM files are similar to XLM files but are based on the Open XML format found in later Microsoft Office software.
Excel competitors
Even though Excel might be one of the most recognizable spreadsheet programs, other vendors offer competing products. Examples include the following:
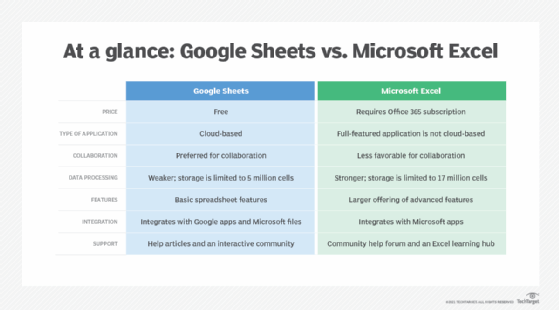
- Google Sheets. Google Sheets is a free competitor to Excel, with similar layouts and features. Users with a Gmail account can access Google Sheets. Google Sheets are saved in the cloud, meaning users can access their spreadsheets from anywhere and on numerous devices. Multiple users can also collaborate on the same spreadsheet.
- Numbers. Apple's spreadsheet program comes free with every Mac and provides prebuilt templates, charts and graphs. Numbers excels at graphics and charts, but it does not handle large data sets as well as Microsoft Excel. Numbers is also exclusive for Apple's devices. But it does enable users to save spreadsheets as Excel files, so a Windows user can still open a Numbers spreadsheet in Excel.
- Apache OpenOffice Calc. This free open source spreadsheet software features multiple user collaboration; natural language formulas that enable users to create formulas using words; DataPilot, which pulls data from corporate databases; and style and formatting features that enable different cell formatting options. The software uses a different macro programming language than Excel and has fewer chart options. OpenOffice Calc works on Windows and macOS platforms. OpenOffice Calc also uses the Open Document Format as its default, with only limited support for Microsoft's XLSX format.

History and future of Excel
Microsoft released Excel in 1985 under the name Microsoft Multiplan. Microsoft's spreadsheet program competed with similar products at the time, including Lotus 1-2-3 from the Lotus Development Corp. Although Lotus 1-2-3 was reportedly the first spreadsheet to introduce cell names and macros, Multiplan used a graphical user interface and enabled users to point and click using a mouse. Multiplan made it easier to manipulate, process and view spreadsheet data.
Initially, Multiplan lost popularity on Microsoft Disk Operating System (MS-DOS) systems when competing with Lotus 1-2-3. Two years after its initial release, in 1987, Microsoft introduced Excel version 2.0. By 1988, this new version, now on Windows platforms, began to outsell Lotus 1-2-3 and other similar spreadsheet programs.
In 1990, Microsoft released version 3 of Excel, with features such as toolbars, 3D charts, and drawing and outlining capabilities. Version 4 came along two years later and added the auto-fill function. In 1993, version 5 of Excel was released. This version included Visual Basic for Applications macros, which enabled regular tasks to be automated.
One of the next big updates to Excel was version 12, which was released in 2007. This update used a new Ribbon menu system. Improved functions included a SmartArt set of diagrams, better management of named variables and more flexibility for formatting graphs. Excel moved to using the more structured and open XLSX files as well. Version 15 released in 2013 included new tools such as Power View, Power Pivot and Flash Fill. This version also improved Multithreading capabilities.
The current version of Excel, version 16, was released in 2019. Since its conception, Microsoft Excel has become one of the most widely used business applications and is often paired with other Microsoft apps such as Word, Outlook and PowerPoint. Although Microsoft no longer updates Excel as different versions, it rolls out new features and updates automatically over time.
Microsoft Excel is arguably one of the most popular spreadsheet applications and has long since played a role in businesses. However, with the popularity of other current spreadsheet software, Excel now has increased competition. The website askwonder.com claims that the collection of apps in Google Suite, which includes Google Sheets, is used by 2 billion users every month, whereas Microsoft Excel has an estimated 750 million to 1.2 billion monthly global users. Google and Microsoft do not publish monthly usage for either spreadsheet program, so it is difficult to estimate values.
Learn more about the different benefits of using Excel for HR in this article.


