Many organizations use data fabrics to connect disparate data sources to a central access point, regardless of their type or location. Some take this further by incorporating knowledge graphs into their data fabrics.
Knowledge graphs bring semantic context to the data, eliminating silos, unifying information and clarifying relationships between data entities across domains and data sources. They enable real-time data interactions and intelligent operations that span hybrid environments while providing a flexible and scalable structure for responding to changes to the data and its sources.
They represent data as interconnected entities and their relationships, linking information in meaningful ways even if it originates from different sources. It provides a foundation for establishing a business-centric structure that organizes the data and allows for modeling complex business relationships across domains.
As enterprises modernize data fabrics to handle hybrid environments, knowledge graphs emerge as the piece that delivers real-time insight, governance and explainability.
1. Semantic layer for analytics
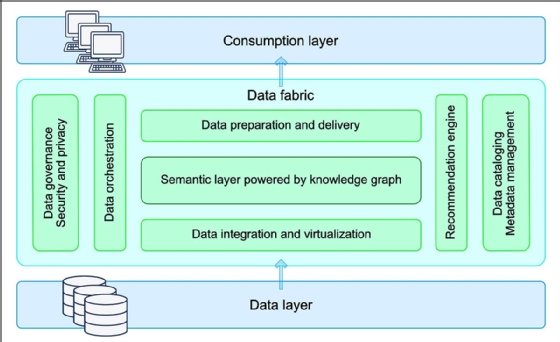
A semantic layer powered by a knowledge graph is integral to effective data fabric design.
A data fabric's semantic layer works with a knowledge graph to provide a unified, contextual view of data – whether structured, semistructured or unstructured -- and translates it into domain-specific business terms. While the fabric offers an integrated architecture for managing information, knowledge graphs supply context by modeling entities and their relationships across various sources.
Because of these capabilities, a semantic layer powered by a knowledge graph is integral to effective data fabric design. The knowledge graph provides a real-world representation of business entities and their relationships, including inferred ones, enabling the semantic layer to support real-time data analytics, data discovery and more effective data governance and metadata management.
Figure 1. The semantic layer in a data fabric.
In practice, this integration provides a context-rich representation of data that improves query relevance and supports self-service exploration.
For example, a manufacturer might use a data fabric to organize supply chain data stored across multiple platforms. The fabric's knowledge graph models business entities, such as vendors, products, parts, orders, customers, suppliers and shipment data, such as shipped_to, purchased_by and supplied_by.
With this structure in place, the semantic layer lets business users ask questions such as "Which orders include machine gaskets from ABC supply company?" or "Which customers will be affected by the hurricane that shut down the Tampa distribution center?" Users do not need to know anything about the source data or how it's stored. In conjunction with the semantic layer and knowledge graph, the data fabric makes it possible to answer such questions quickly and easily, regardless of where the data resides.
2. Dynamic modeling for cross-domain relationships
Knowledge graphs are built on two basic components: nodes and edges. Nodes represent classes of entities -- such as customers, products, patients, diseases, orders -- while edges represent the relationships between those entities, spanning domains or data sources.
To see how this works, consider a knowledge graph with nodes representing universities and colleges, while another represents cities and towns. Each school is tied to a location, so a relationship exists between the school and its city. For instance, the University of Washington is in Seattle, creating an is_located relationship.
What sets knowledge graphs apart from other models, such as relational databases, is how they treat edges as first-class citizens. Along with nodes, edges are central to the graph's structure, providing meaning and context. They can include labels and properties, belong to specific classes and connect cross-domain nodes such as products and customers. Edges also support queries that traverse relationships across domains.
This design offers significant flexibility for modeling data by linking domains into complex relationships that can evolve. New node and edge classes can be added without affecting the existing structure, allowing the schema to update dynamically as requirements change. A knowledge graph can also logically infer relationships across domains as the model develops.
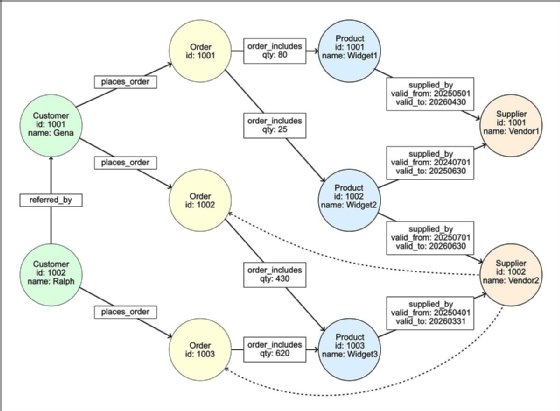
This flexibility can be illustrated in a customer ordering system. The graph includes four classes of nodes: customers, orders, products and suppliers, and four classes of edges: places_order, order_includes, supplied_by and referred_by.
Figure 2. A flowchart that depicts an example of dynamic modeling for cross-domain relationships.
Edges provide a direct mapping between nodes that establish cross-domain relationships. From this model, a user can easily determine that Ralph ordered 620 Widget3 items provided by Vendor2. Edges can also infer other relationships, as indicated by the dotted lines in the graphic above. In this case, if Vendor2 cannot supply the Widget3 items, orders 1002 and 1003 cannot be fulfilled.
Nodes and edges can also include properties. For instance, supplied_by edges include the valid_from and valid_to date properties. These show that Vendor1 once supplied Widget2, but it is now supplied by Vendor2, providing historical context. The graph can also accommodate new node classes, such as Return or Rating, and new edge classes, such as returns_product or submits_rating.
3. Operational intelligence
Operational intelligence (OI) is a growing concern for many organizations, and knowledge graphs in data fabrics help identify OI issues in real time. Teams can use knowledge graphs to monitor operations and act on the available information. Organizations can incorporate business rules and constraints in graph-native formats to automatically flag potential issues and alert key individuals when setting up their knowledge graphs.
Knowledge graphs enable data fabrics to support many OI use cases. In manufacturing, knowledge graphs can spot supply chain data bottlenecks and assess their effects on deliverables. They can also track industrial IoT sensor data to ensure optimal operations.
IT teams can use knowledge graphs in data fabrics to organize telemetry, logs and other data collected across their networks, helping optimize systems and simplify troubleshooting. These knowledge graph use cases extend across industries, including telecommunications, retail, healthcare, utilities, government, cybersecurity and financial services.
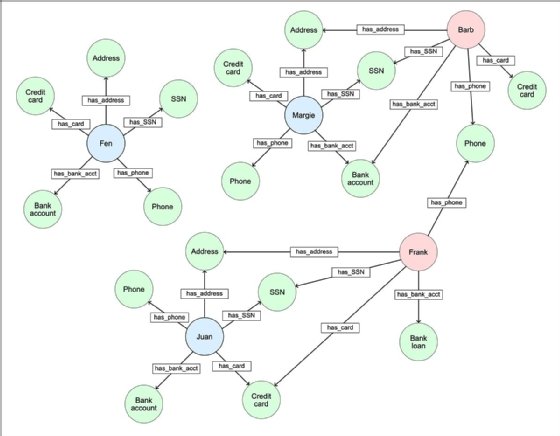
In financial services, a bank might incorporate a knowledge graph into its data fabric to detect anomalies and fraud. In a simple example, the graph includes three long-term customers -- Fen, Margie and Juan -- and two newer customers -- Barb and Frank. Barb and Frank provided information suggesting fraudulent activity or ties to a larger fraud ring.
Figure 3. A knowledge graph showcasing fraud detection.
This knowledge graph offers several clues of fraud. Barb has the same address, bank account number and social security number as Margie, and Frank has the same address, credit card number and social security number as Juan.
Shared addresses and bank accounts are not unusual. However, shared social security numbers are a serious concern, especially when paired with other shared variables. Adding to the concern, Frank and Barb share a phone number, suggesting they're part of a larger fraud ring.
To detect issues like these, the knowledge graph can include business rules or constraints that flag duplicate social security numbers along with shared addresses or other commonalities. Testing and reviewing these rules is essential to ensure they detect and flag suspicious activity without creating unnecessary problems for legitimate customers.
4. Enterprise search and model explainability
Data fabrics with knowledge graphs can significantly enhance enterprise search capabilities by enabling search engines to return faster, more accurate and relevant results than traditional systems. A search engine can use the data fabric's semantic capabilities and the knowledge graph's flexible structure of nodes and edges.
In addition to providing semantic understanding of the data, knowledge graphs are contextually aware and can traverse entity relationships across domains. This makes it possible to distinguish between ambiguous terms, such as the movie "Heat," the basketball team Miami Heat and the temperature. Users can also ask questions in natural language and trust that their intent will be understood.
Major technology providers illustrate how these capabilities work in practice. Google has led the effort by using knowledge graphs to enrich its search capabilities. Google Knowledge Graph, launched in May 2012, is backed by a massive database of entity relationships, resulting in more intelligent and context-aware search capabilities. It enables Google to better grasp the meaning behind user queries, understanding the search terms and how they relate to each other.
Google Knowledge Graph lets the search engine return additional content with the primary search results. Querying Google for "Georgia O'Keeffe" produces an Overview panel with biographical information from Wikipedia, images, related details and links to even more information.
Figure 4. Google Knowledge Graph compiles related data to enhance the search.
Other popular services also use knowledge graphs to enhance search and discovery. Bing applies a knowledge graph like Google's to enrich results with related information. Amazon uses one to improve product searches, connect related products and deliver relevant purchase recommendations. LinkedIn's Economic Graph provides a digital representation of the global economy, mapping connections among people, jobs, skills and professional relationships to gain insights into labor markets and workforce trends.
5. Intelligent metadata management
An effective data fabric relies on metadata to make sense of connected data. A knowledge graph uses metadata to add meaning and context to identify relationships between entities across domains and data sources. This brings intelligence to metadata management, supporting discovery, catalog enrichment and policy automation at scale.
Discovery is supported through semantic search capabilities, which help users quickly find the information they need. Instead of relying only on keyword matching, they can search with familiar business concepts and terminology. The knowledge graph links business, technical and operational metadata into a unified structure of entities and their relationships, adding meaning and context to user queries.
With intelligent metadata management, users can get complete, relevant answers to their queries without technical expertise or needing to submit IT requests. A business user might request the query, "Provide me with the number of women's running shoes sold to customers in Canada in 2024, broken down by shoe model." The knowledge graph, with its underlying metadata, can quickly answer and provide comprehensive insights across domains.
The knowledge graph also enriches the data fabric's catalog. A key capability is inferring new metadata from existing context and relationships. For example, if Kelly works in the sales department and sales is part of the marketing division, the graph can infer that Kelly is part of the marketing division.
It enhances the catalog by automatically tagging and classifying data. If multiple datasets include the product_name column, the same tag is assigned to unify the metadata and provide a more complete view of the available information. Knowledge graphs can also link metadata to business glossaries and assign new classifications based on existing domains, relationships and other variables.
Knowledge graphs further support policy automation at scale. Organizations can model policies based on entities, relationships and metadata. These policies are implemented as constraints or triggers that apply automatically based on specific events or circumstances. Policies can monitor for changes in schema, changes to data sources or check data for compliance with HIPAA, CCPA, GDPR or other regulations.
Robert Sheldon is a freelance technology writer. He has written numerous books, articles and training materials on a wide range of topics, including big data, generative AI, 5D memory crystals, the dark web and the 11th dimension.