Elastic Stack Security tutorial: How to create detection rules
This excerpt from 'Threat Hunting with Elastic Stack' provides step-by-step instructions to create detection rules and monitor network security events data.
Security researchers have a variety of threat hunting tools at their disposal. One such tool worth considering is the free, open code Elastic stack, said Andrew Pease, principal security research engineer at Elastic and author of Threat Hunting with Elastic Stack.
In his book, Pease introduces readers to the Elastic Stack suite. He explains how the suite of tools helps users collect data, analyze it and create visualizations.
In this excerpt from Chapter 8, "The Elastic Security App," Pease explains how to start using different functions of the Elastic Stack Security app, formerly Elastic SIEM. Learn what to expect from the Security dashboard, such as how to create and implement detection rules and exceptions and how to monitor them.
Download a PDF of Chapter 8 to learn how to create different machine learning rules, how to use and customize the trend timeline dashboard page, and how to understand the event details panel in the Security app.
The Elastic Security app overview
The Elastic Security app is the central point for Elastic's security solution. It includes a security news feed, host and network data, detections, timelines, cases, and an abstracted view into the administration of the Elastic endpoint configuration.
To get to the Elastic Security app, click on the hamburger menu and select Overview under the Security heading. This landing page will show you the highlights of the events that are in the security app. From here we can jump into specific sections that show their relevant data:
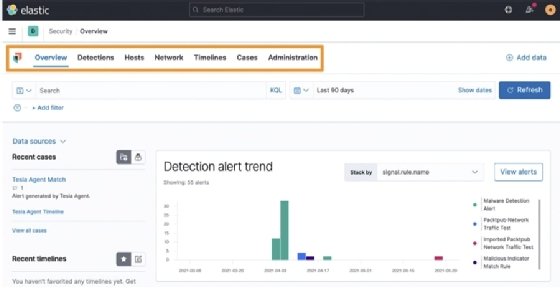
You can scroll through this Overview section to get a high-level look at the different types of data that are reflected in the app. Most notably, at the bottom of the Overview page, there is a breakdown of the different datasets, separated by host and network, that we're sending into the Elastic Stack:
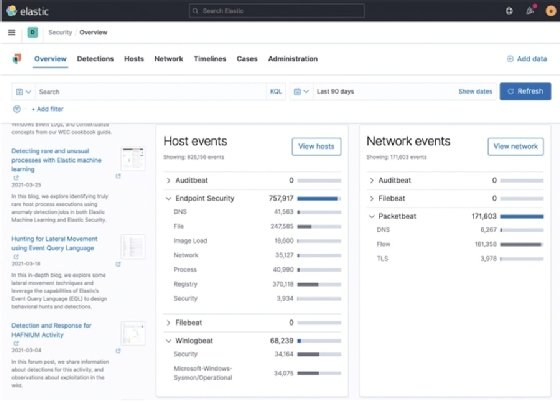
This Overview page allows us to see important information that is relevant across the entire Security app. To get additional information, we will use the section tabs at the top of the Overview page.
 Learn more about Andrew Pease's
Threat Hunting with Elastic
Stack here.
In this section, we learned how to get to the Elastic Security app Overview page. Next, we'll explore the detection engine.
The detection engine
The Detections section is used to investigate and create detection logic. Detection logic can be the results of a malware hit from a signature or behavior as well as potentially malicious activity. As of Elastic version 7.12, the detection engine has over 500 pre-built rules that are created by the Elastic Intelligence and Analytics Team and the Elastic community:
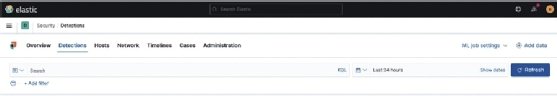
Keeping with the theme across the rest of Kibana, you can apply specific queries directly into the Detections section or apply a date picker selection to narrow any searches.
In this section, we began to explore the detection engine of the Elastic Security app. In the next section, we'll learn about managing the detection rules.
Managing detection rules
One of the most powerful features of the Elastic Security app is the detection rules. Detection rules are pre-configured queries that compare events from various data sources to identify non-signature-based malicious activity.
As an example, perhaps you want to know whether you have systems that are receiving Remote Desktop Protocol (RDP) connections from outside your network, whether someone is trying to brute force through Secure Shell (SSH), or someone is trying to export your Windows Registry Hive. These things could be malicious in your environment, but these are events that will not be detected by traditional anti-virus.
Elastic has released hundreds of open source rules for the detection engine and has made them all available on GitHub. As I mentioned before, there are 546 rules available for free. Not only are the rules available on GitHub, but they are also automatically loaded in Kibana. You may remember in Chapter 5, Building Your Hunting Lab -- Part 2, we loaded all of the prebuilt rules:
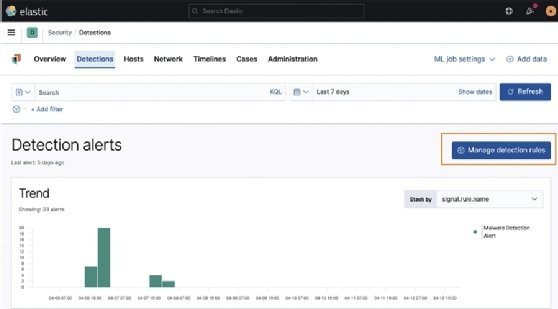
If you click on the Manage detection rules button, it will open the Detection Rules management section.
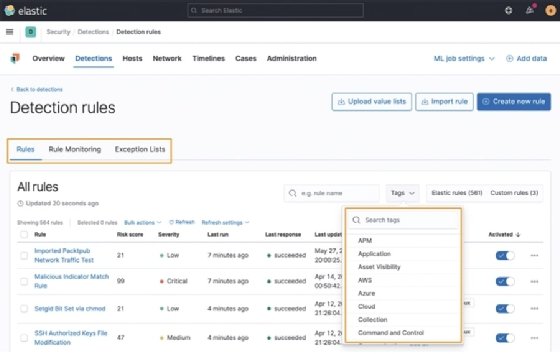
From here, we can see the Rules, Rules Monitoring, and Exception Lists tabs.
Rules
From this tab, we can enable different rules, search for rules by their names or tags, or dig into the rules to learn more about them:
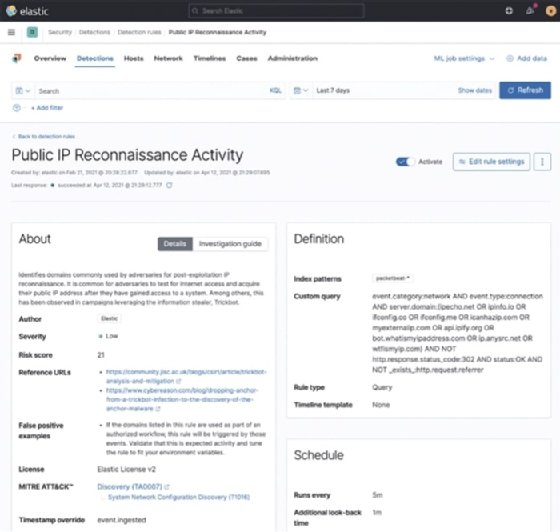
Clicking on a rule will open the rule so that you can inspect the metadata about the rule, where the data must come from, what the query is, and so on:
Important note
You cannot modify the Elastic-provided rules, but you may make a duplicate and modify the duplicate if necessary.
This overview of the rules will help you determine what rules you want to enable and what rules don't make sense in your environment. As an example, if you aren't collecting cloud security rules, or Linux or macOS events, it doesn't make sense to enable those rules.
Rule monitoring
Clicking on the Rule Monitoring tab will give you a view of the amount of time the rules take to run:
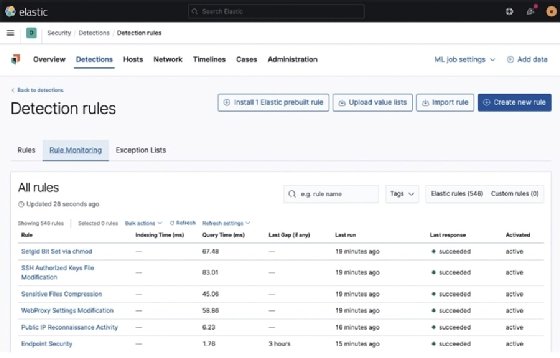
Rule Monitoring can be helpful if you're noticing a performance impact; you can look at what rules are taking the most time and decide if you need to increase the resources for your stack or if those rules are needed.
Exception Lists
The Exception Lists tab is where you can view any exceptions you've created for rules or the endpoint:
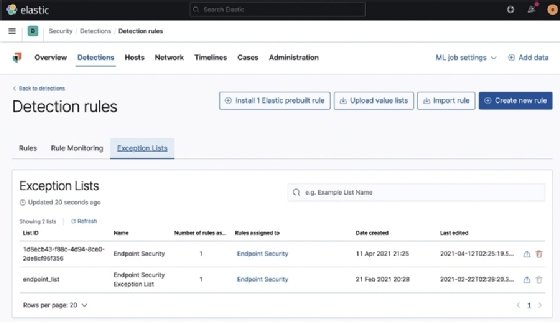
We'll talk more about the exception framework in the Event actions section, a bit further on in the chapter.
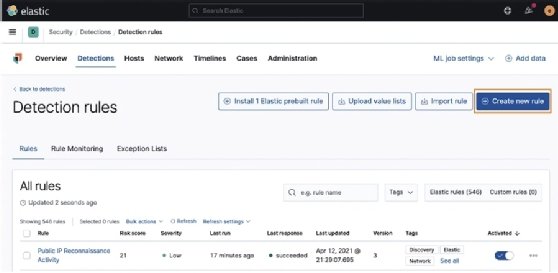
Creating a detection rule
I mentioned that Elastic provides 546 rules for you, but we can also create rules that fit a specific threat profile for our environment.
Rules can either be created using a Python module that Elastic provides and has made available, or be created and made available through Kibana.
To get started, click the blue Create new rule button:
There are five types of rules that you can create:
- A Custom query (KQL or Lucene rule)
- A Machine Learning rule
- A Threshold rule
- An Event Correlation rule
- An Indicator Match rule
Next, we'll walk through the creation of these rule types.
Important note
For the detection rules, the first section (Define rule) will change depending on the rule type that you're going to use, but the three follow-on sections will all be the same (About rule, Schedule rule, and Rule actions). We'll go all the way through the four sections for the Custom query type and just the first section for the other four rule types.
Custom query rule
By default, the rule type will be Custom query. This is how you'd create a KQL or Lucene query.
Below the rule type, you can select what index patterns your data will be in. By default, all of the possible index patterns are added. As we only have Endpoint, Packetbeat, and Winlogbeat data, we can safely remove the unused datasets.
Next, we can enter our query. As an example, I am looking for network connections to the domain packtpub.com:
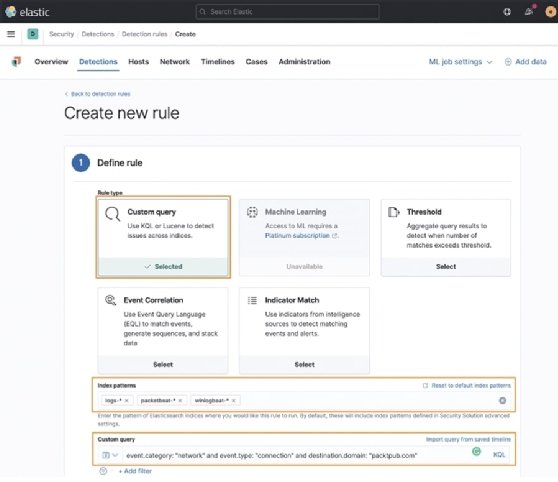
Here we can see what the first part of the rule will look like.
Elastic has added the Preview results feature so you can test to see whether your query is working as intended:
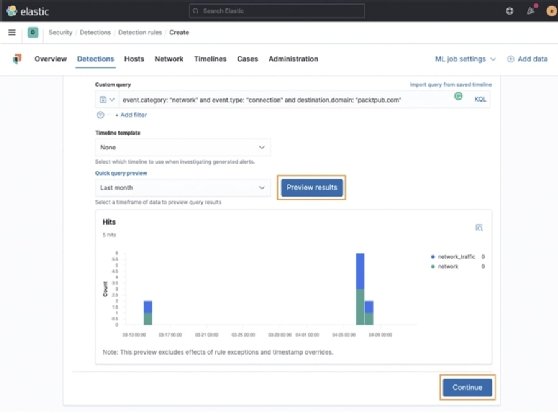
After we've set up the rule type and the data sources, written our query, and tested the results, we can click on Continue to move onto the next step.
In the second section, we can define the name, description, severity, and risk score, and add any organization tags:
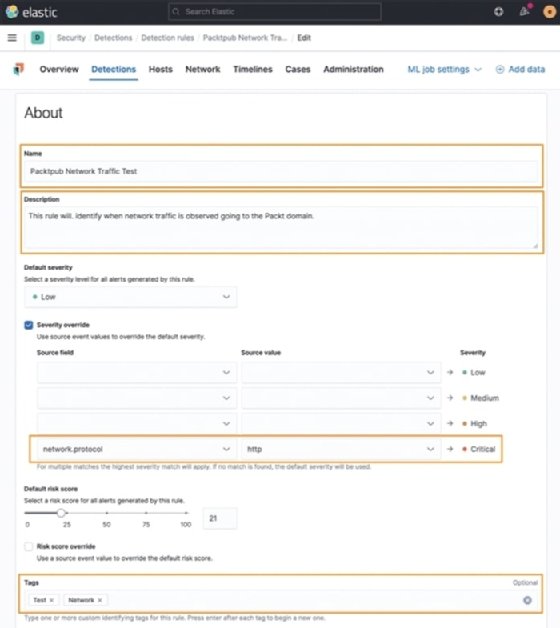
The default severity is Low and the risk score is 21. As you change the severity, the risk score will automatically adjust. This can also be manually tuned if you have organizational policies that dictate a severity and risk matrix.
You can also override the defaults for severity and risk. In the preceding figure, I have changed the severity from Low to Critical if the network traffic is unencrypted over the HTTP protocol instead of TLS.
Clicking on the Advanced settings dropdown, we can add some additional information about the rule. These settings are optional:
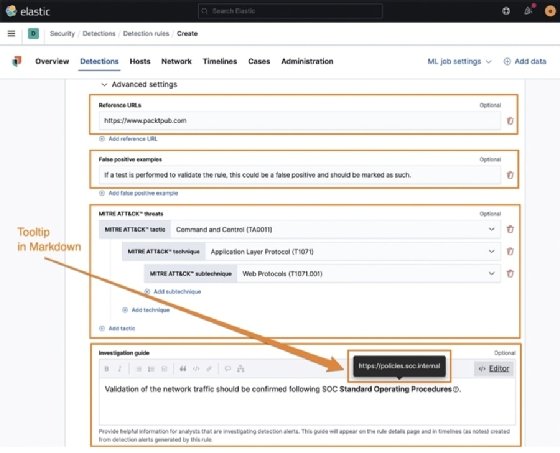
Here we can define any reference URLs that can help provide some context when performing an investigation. I like to put the source of the threat reports that may have led to the rule creation here.
We can provide some false positive examples.
We can add MITRE ATT&CK tactics, techniques, and subtechniques. The ATT&CK model was covered in Chapter 1, Introduction to Cyber Threat Intelligence, Analytical Models, and Frameworks.
We can also add investigative notes. This can be used to link to organization-specific documentation, points of contact, and so on. This guide renders GitHub-flavored Markdown, which is helpful to use for inserting hyperlinks and tooltips.
GitHub-flavored Markdown can create hyperlinks using [URL Text](url) and tooltips with !{tooltip[anchor text](helpful description)}.
Moving on, we can populate the Author field and add the appropriate License details:
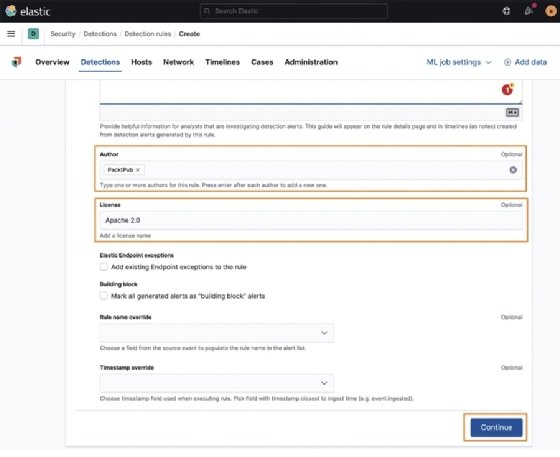
We can also choose to apply any exceptions to this rule; we don't have any yet, but if we wanted to apply exceptions, we could check that box.
Building block rules are low-risk rules that we can create that will still write to the rules indices but not be displayed in the Alerts table in the main Detections view. This is helpful if you want to create a rule for context for other rules but not clutter up your view.
Rule name override will allow you to override the rule name we set before with the value of a field from the event. As an example, we could use the destination.domain field to name this rule packtpub.com when it is displayed in the Alerts table.
If we want to use a different timestamp than the default @timestamp, we can define that here.
Next, we can click Continue to move on.
We can define the schedule for the rule. This is how often the rule will run and how far back it should look. The lookback is to ensure there aren't specific events that happen to fall between the rule executions that could be missed.
The default is to run every 5 minutes with a 1-minute lookback. I prefer to change this to run every 9 minutes with a 1-minute lookback:
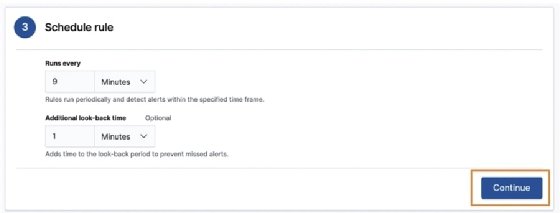
After we have set the schedule and the lookback, we can click Continue to move on to Rule actions.
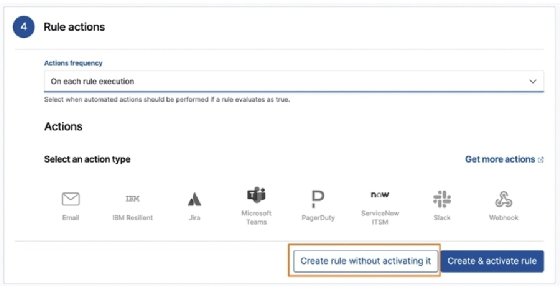
We can define how often the rule actions are performed, but they allow you to send notifications to third-party services. Actions to these external services are a paid feature.
Finally, we can create the rule. I always prefer to create the rule without activating it (meaning it will generate an event in the Detections section) so I can take one final look at the completed rule before I run it:
Once we've created the new rule, we'll land back on the Detection rules management page. We can click on Custom rules to view our new rule:
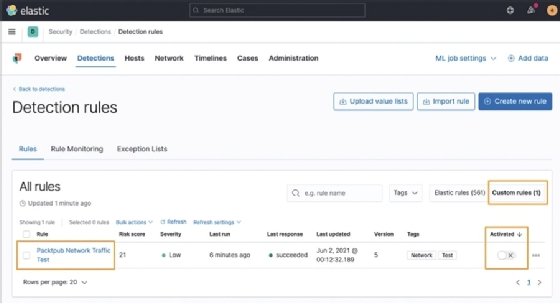
Clicking on the rule name will open the rule and we can make a final check, make any necessary changes, and activate (or deactivate) it when you are ready to generate events with it:
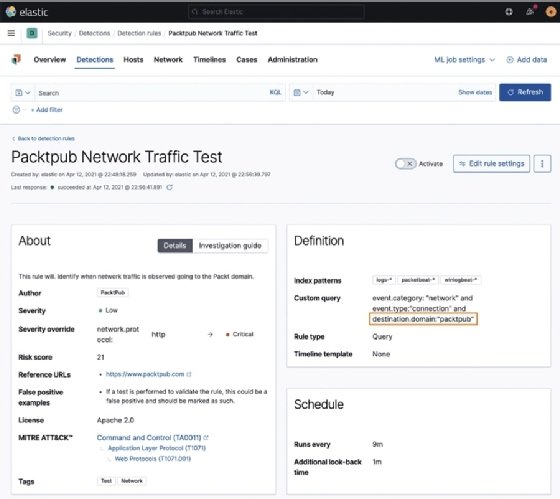
As a real-world example, you notice in the preceding figure that the destination domain isn't right. I can click on the Edit rule settings button and adjust the domain to include the .com Top-Level Domain (TLD):
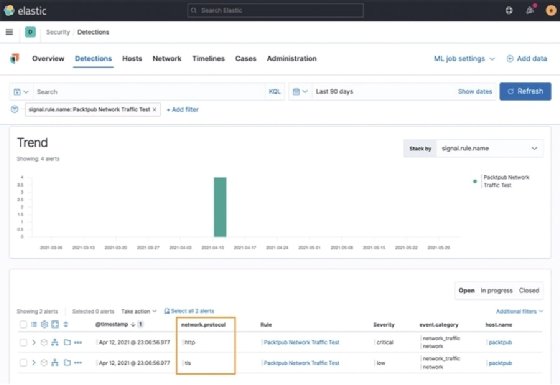
After adjusting my mistake, I can see an execution of the rule and we can even see the severity override we did for the HTTP connection.
We created a custom query rule with KQL; next we'll explore the machine learning rule.