OpenTelemetry eBPF Instrumentation provides zero-code observability for Kubernetes applications using kernel-level eBPF, then complements SDK instrumentation for deeper insights.
OpenTelemetry eBPF Instrumentation (OBI) is a recent addition to OpenTelemetry's toolkit for zero-code instrumentation, donated to the OpenTelemetry (OTel) project by Grafana in mid-2025.
The project originally started as Grafana Beyla in 2023 with the goal of helping users to get started quickly with application observability using eBPF. eBPF is a technology that allows programs to run inside an OS. These programs can then hook onto calls that your application makes to the kernel (the core part of the OS) for networking, file I/O, memory allocation and process management.
OBI is then simply a program that consists of hooks into calls made to the OS, enabling RED metrics (rate, errors, duration), distributed traces and service graphs. When an application queries a database or handles an HTTP request, hooking into that I/O means no changes to the application need to be made to observe it. Encrypted traffic is the one catch. By the time an HTTPS request reaches the socket, it's already ciphertext, so OBI reads it one layer up, hooking the TLS library that the app links against. Follow the same idea as before -- instrument at a lower layer than the application, not within the same layer.
This is a huge advantage because traditionally, observability and metrics meant instrumentation of your application. At the most basic level, an application's code could be modified to contain different logging messages that show timing and error rates. More commonly, specific instrumentation libraries are used to augment the underlying programming language's functions with custom code that automatically collects observability data and metrics.
eBPF and, therefore, OBI are the next logical steps in instrumentation. If an application can be instrumented by augmenting the functions of its programming language, why not augment them with custom instrumented code at an even lower level, like the OS? Doing so means the instrumentation is programming language agnostic. All applications must make certain calls through the OS. The OS is essentially a chokepoint at which the calls an app makes can be observed.
To show how OBI works, I've created a demo that we'll walk through in order to understand everything in more detail. The moving parts of the demo are as follows:
The LGTM stack for observability of the applications and metrics and traces from OBI.
To start the demo, you can simply run the demo.sh script under the scripts directory, which will coordinate all the other scripts responsible for setting up the cluster, installing the applications, the LGTM stack and OBI. The prerequisites for running the demo are all in the README -- ensure you've got everything set up locally. The demo script will also confirm that these prerequisite tools are available before proceeding.
One prerequisite is worth calling out explicitly, because it's the most common thing that trips people up: OBI needs a reasonably modern Linux kernel with eBPF and BTF support. The demo checks for this upfront and will stop with a clear message rather than failing halfway through. If your environment isn't ready, you'll know immediately. In practice, this is rarely a hindrance. Essentially, all current default node images from the major cloud providers ship a recent kernel with BTF enabled.
Running the demo script
The first thing we can see when running the script is that the cluster has been created, the demo app is up and there are no metrics or traces, since we haven't installed OBI:
At this point, we're showing that we've deployed a very basic app and have no instrumentation set up. In the next step, deploying OBI adds a privileged DaemonSet that runs on every node in the cluster to inject the OBI eBPF program into the node's kernel. This means the other processes running on the node now get picked up by OBI's eBPF program, giving us RED metrics, the service graph and distributed traces. It's worth being transparent about what that costs. Using OBI means running a privileged pod, one per node, that can see every process on the node and load programs into its kernel. That's an important trust boundary to consider. The main mitigation for this is scoping OBI to the namespaces you care about. In our demo, it's pointed only at the demo namespace, rather than letting it watch everything on the node.
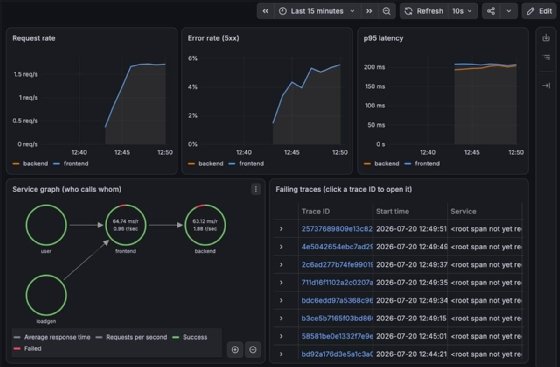
After deploying OBI, we can see the custom dashboard in Grafana start to fill in:
Without any modifications to the two Go applications code or containers, we now get a service graph, distributed traces and RED metrics. It's truly never been easier to get these valuable data points for your application. The same approach works across languages and frameworks. The RED metrics and service graph come straight from observing traffic at the kernel, so any HTTP/gRPC service on a node with a modern eBPF-capable kernel is fair game, no matter what it's written in. What we're missing here is insight into the application itself, but we get 80% of the observability with OBI.
It is reasonable to question what all this costs at runtime. The answer is not much. The probes fire inside the kernel on work that the request was already doing. There's no per-request instrumentation running inside your application and no library sitting in its hot path. The overhead is low enough that you can comfortably default to running it on all your applications. That breadth is what pays off the moment something breaks. When your application starts returning errors, OBI already tells you which service is responsible.
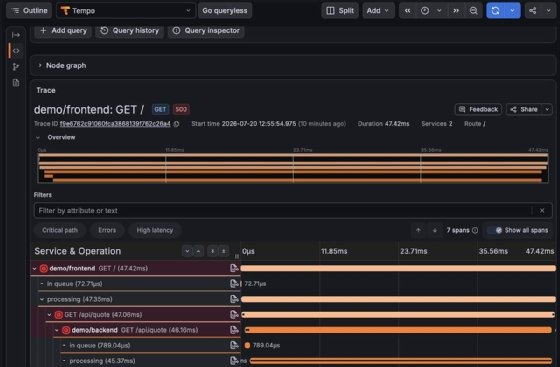
Look at the traces for errors at this stage with only OBI installed:
We can see the flow of calls from the frontend to the backend and specifically which call resulted in an error, the GET /api/quote call to the backend. What's still missing is which function inside the backend code is specifically responsible for this failure. Because OBI only gives us instrumentation at the kernel level, the finer details like this are not available through OBI alone.
In the next phase, we'll see how using the OpenTelemetry SDK for Go in the backend can give us the highest level of detail, while also remaining compatible with what OBI has already given us.
Adding the SDK instrumentation
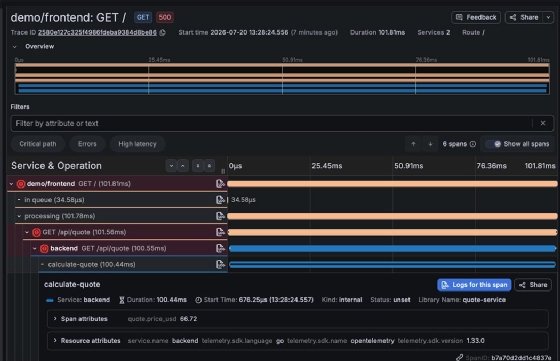
Here's the output we should see from the demo script when moving on to phase 2:
The backend has been swapped for an image with the same functionality, now carrying OpenTelemetry's own SDK instrumentation. OBI notices the service has started exporting its own OpenTelemetry Protocol (OTLP) traces and automatically backs off, suppressing its own backend traces to avoid duplicates, while still contributing that service's span, service-graph, network and process metrics. In other words, the backend never loses observability. OBI just stops re-tracing what the SDK now traces itself and keeps giving us everything else it was producing. Now, when we dig into the traces again, we can see all the necessary details around what the function behind /api/quote is and why it might be failing, if there was a legitimate reason.
OBI is a young project, but it's evolving fast. Since the handoff from Grafana, it's been maturing inside OpenTelemetry and pushing toward a 1.0/general availability release, and the direction is clear: Make zero-code, kernel-level observability something you can switch on for any workload in a cluster without a second thought.
With OBI, observability is no longer an all-or-nothing, instrument-everything-up-front effort.
Throughout the demo, we saw how easy it really can be. In minutes, with no code changes and nothing injected into your containers, you get RED metrics, a service graph and distributed traces across every service you're running. That's enough to see the different moving parts of your system and, crucially, where things might go wrong. Later, when the service graph points you at the one service that's slow or failing for reasons the kernel can't elaborate on, you can reach for the OpenTelemetry SDK and add more detail. OBI steps aside so the two never double-count.
With OBI, observability is no longer an all-or-nothing, instrument-everything-up-front effort. You get breadth for free and can then spend your effort only where it provides value. Start with zero-code and add depth where it counts.
Matt Grasberger is a DevOps engineer with experience in test automation, software development and designing automated processes to reduce work.