
Getty Images/iStockphoto
How to use Cilium Hubble for network observability
Cilium's Hubble tool provides network observability while working in Kubernetes. This guide explains how Hubble works and how to set it up in a Kubernetes cluster.

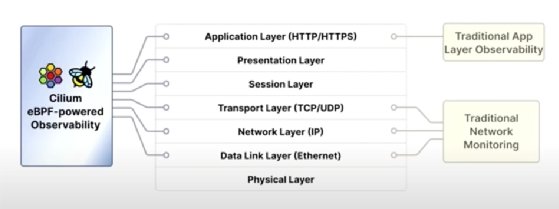
Tracking down a network issue can be difficult, as various teams try to determine where the problem begins. These issues often lead to finger-pointing. Observability tools, such as Cilium Hubble, can help clear up the confusion by looking across all layers.
When users struggle with errors and slow application responses, the application team receives those reports. The application team is only interested in Layer 7 and might not find any problems there, causing them to blame the network. Meanwhile, the platform team doesn't see anything wrong, nor can the network team find any latency issues on Layers 2, 3 and 4, where most traditional network monitoring tools examine.
At scale, it's even more difficult to identify a problem's source. Clusters with hundreds or thousands of nodes run many servers with replicas in the cloud. Keeping track of and understanding all workloads' data and logs based on their IP address is tedious and time-consuming, especially when dealing with multi-cloud or on-premises data centers. In most cases, virtual private cloud logs don't have any context of the application.
Existing tools tend to fall short. Low-level troubleshooting, such as TCP dumps, helps with network visibility but doesn't offer cluster-wide and application context. Modifying the application code to instrument it and add metrics only offers the application context, not the underlying network context.
An emerging option is to implement full-stack observability, from the network layer to the application layer, without requiring invasive application or infrastructure changes. Cilium Hubble offers distributed observability, monitoring and tracing that teams can use to inspect flows inside Kubernetes clusters and troubleshoot network connectivity.
How Hubble uses eBPF
Extended Berkeley Packet Filter (eBPF) is a Linux feature that enables efficient, secure and dynamic small program attachments to the kernel at various attachment points. This technology extends the kernel's capabilities without changing the source code or loading modules.
The following example is an eBPF program written in C and invoked whenever there's an outgoing packet on a certain interface. This program extracts the package's Ethernet and IP header and the transported payload's protocol.
SEC("action")
int observe_egress(struct _sk_buff *skb) {
    // Extract data for Ethernet and IP Header
    void *data = (void *)(long)skb->data;
    void *data_end = (void *)(long)skb->data_end;
    if (data + sizeof(struct ethhdr) + sizeof(struct iphdr) > data_end)
        return TC_ACT_UNSPEC;

    // Read Ethernet Header
    struct ethhdr *eth = data;
    if (eth->h_proto != constant_htons(ETH_P_IP))
        return TC_ACT_UNSPEC;

    // Read IPv4 Header
    struct iphdr *ip = (data + sizeof(struct ethhdr));
    trace_printk("Observed IP Pocket: %lu -> %lu (%d)\n",
                 ip->saddr, ip->daddr, ip->protocol);

    return TC_ACT_OK;
}
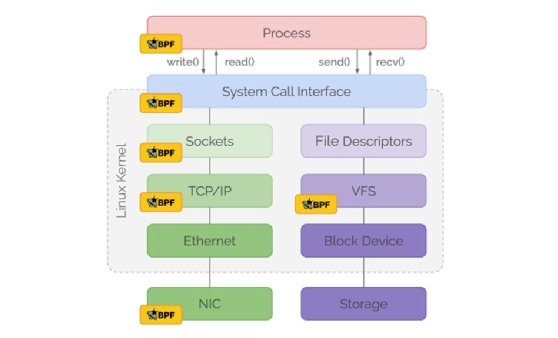
Cilium attaches eBPF programs to Kubernetes pods inside the system or on the local node. Then, it subscribes to the Kubernetes API for information about resources, such as existing pods, services and nodes added to the clusters, as well as network policies that need to be enforced. Cilium takes the obtained data and writes it into BPF maps, which the eBPF data path then accesses. A pod must go through the eBPF data path if it wants to connect to another pod on the same node or entities on a remote node.
The data path takes the incoming connection and inspects the packages to determine if it must perform load balancing, rewrite the packet or access the service map to find frontends and backends. It also checks the source and destination IP addresses to see if they are known identities, which is important for policy enforcement.
The data path emits traces and drops policy events based on network and host policies and then pushes them into a BPF map. A Cilium instance running inside a Cilium agent reads the BPF map. The instance collects networking events, stores them in a buffer and exposes them by gRPC and metrics. Other Hubble components, such as the GUI, and Prometheus can use the events.
Hubble architecture and components
Hubble architecture runs on a Cilium agent, which holds the Hubble server. Components, such as Hubble CLI, Hubble UI and Hubble metrics, run inside the Hubble server.

Hubble architecture
Hubble runs on eBPF and Cilium software. The Cilium agent runs the Cilium-agent library, which acts as a Container Network Interface to manage connectivity, observability and security for all CNI-managed Kubernetes pods. The Cilium agent runs on a DaemonSet on every Kubernetes node, injects eBPF programs into the kernel, enforces network policies and feeds raw network data to Hubble.
Hubble's server resides within the Cilium agent. Each node has its own Hubble server, making it fully distributed. This component collects eBPF-derived visibility data and serves it up via a gRPC API over a Unix socket or Hubble Relay.
Hubble Relay acts as a cluster-wide aggregator. It provides users with full network visibility across one or multiple clusters by pulling data across nodes into a unified view.
Hubble components
1. Hubble CLI
Hubble CLI is a command-line binary that retrieves flow events by connecting to either Hubble Relay's gRPC API or the local server. It's similar to a TCP dump but with detailed flow visibility.
Hubble CLI carries out extensive filtering based on the following:
- Certain pod labels.
- Namespace.
- Protocols.
- Verdicts.
To troubleshoot a flaky service, run the hubble observe --to-pod my-app command. It's also possible to use some of the HTTP methods or status code for troubleshooting. To do so, render the network traffic flow logs in JSON format by adding the -o json flag to the hubble observe command.
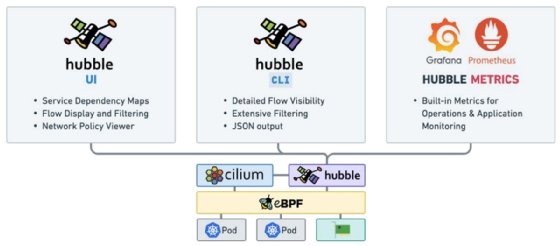
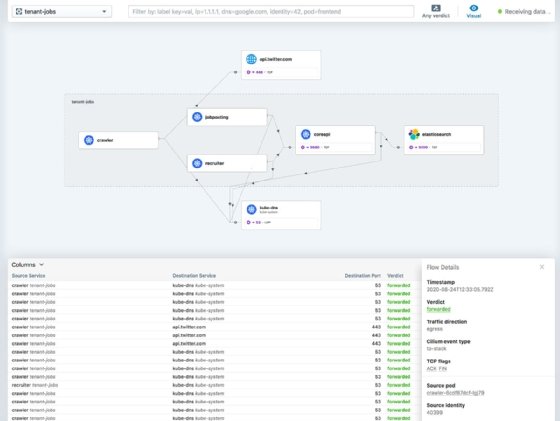
2. Hubble UI
Hubble UI provides a GUI to see all network flow traffic in one dashboard. It includes service maps in the visualization and can easily switch between namespaces in a cluster.
3. Hubble metrics
Hubble metrics expose an endpoint that can be scraped for tools like Prometheus when enabled using Helm's hubble.metrics.enabled=true. It has built-in metrics, such as the following:
- TCP.
- HTTP.
- DNS.
- Internet Control Message Protocol (ICMP).
- User Datagram Protocol (UDP).
It is quite customizable and extensible. Users can choose to write their own metrics and visualize this data with Grafana.
Hubble capabilities
The following are some of Cilium Hubble's primary capabilities:
- Layer 7 metrics collection and protocol visibility to dig into Layer 7 details, such as HTTP requests or DNS lookups, without extra instrumentation.
- Network flow logging with real-time flow logs that enable packet tracking with pod-level context, including source, destination and policy outcomes.
- Distributed tracing that integrates with OpenTelemetry.
- Advanced visualization through Grafana.
- Service dependency mapping that enables users to see who's communicating, how often and over what protocols.
- Policy enforcement insights that confirm whether network policies work as intended.
- Troubleshooting that enables users to pinpoint failed connections, latency spikes and DNS issues in seconds.
Setting up Hubble in a Kubernetes cluster
The following instructions detail how to set up Hubble in a Kubernetes cluster, as per Cilium's documentation for version 1.17.1. These steps assume the use of macOS. Other OSes require slightly different coding, which can be found in this document.
Prerequisites
Before setting up Hubble, make sure to install the following:
- kind ≥ v0.7.0.
- Helm ≥ v3.13.0.
- kubectl ≥ v1.14.0.
- docker stable.
Consult each installation's documentation during this process.
Configure kind
Configuring kind clusters is an important step. Before working with Hubble, users must disable the default CNI and replace it with Cilium. To do so, they must configure basic kind clusters using a YAML configuration file. A basic kind cluster consists of three nodes: one control plane and two worker nodes for testing Cilium features. Use the following code to create a config.yaml file.
kind: Cluster
apiVersion: kind.x-k8s.io/v1alpha4
nodes:
   - role: control-plane
   - role: worker
   - role: worker
networking:
  disableDefaultCNI: true
Step 0. Create a cluster using kind
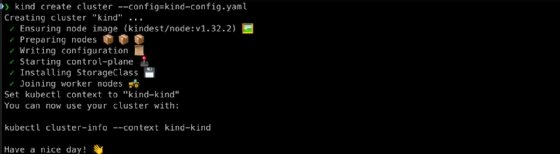
To create a cluster using kind, run this command from the same directory.
kind create cluster --config=kind-config.yaml
Next, specify the kind cluster you want to work with using the following command.
kubectl cluster-info --context kind-kind
Step 1. Install Cilium
To install Cilium, first, set up the Helm repository using the following code.
helm repo add cilium https://helm.cilium.io/
Next, preload the cilium image into each worker node in the kind cluster by running the following code.
docker pull quay.io/cilium/cilium:v1.17.1
kind load docker-image quay.io/cilium/cilium:v1.17.1
Once that's done, proceed to install Cilium via Helm with the following code.
helm install cilium cilium/cilium --version 1.17.1 \
   --namespace kube-system \
   --set image.pullPolicy=IfNotPresent \
   --set ipam.mode=kubernetes
To validate the Cilium installation, try installing Cilium CLI. With this, Cilium CLI should be successfully installed.
CILIUM_CLI_VERSION=$(curl -s https://raw.githubusercontent.com/cilium/cilium-cli/main/stable.txt)
CLI_ARCH=amd64
if [ "$(uname -m)" = "arm64" ]; then CLI_ARCH=arm64; fi
curl -L --fail --remote-name-all https://github.com/cilium/cilium-cli/releases/download/${CILIUM_CLI_VERSION}/cilium-darwin-${CLI_ARCH}.tar.gz{,.sha256sum}
shasum -a 256 -c cilium-darwin-${CLI_ARCH}.tar.gz.sha256sum
sudo tar xzvfC cilium-darwin-${CLI_ARCH}.tar.gz /usr/local/bin
rm cilium-darwin-${CLI_ARCH}.tar.gz{,.sha256sum}
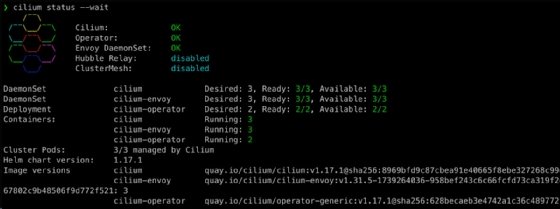
Step 2. Check Cilium status and enable Hubble
Check Cilium status, and wait for Cilium to be ready using cilium status –wait.
Next, using Cilium CLI, enable Hubble with the code cilium hubble enable.
Step 3. Install the Hubble client
The Hubble client gives users access to the observability data collected by Hubble. To install the Hubble client, use the following code.
HUBBLE_VERSION=$(curl -s https://raw.githubusercontent.com/cilium/hubble/master/stable.txt)
HUBBLE_ARCH=amd64
if [ "$(uname -m)" = "arm64" ]; then HUBBLE_ARCH=arm64; fi
curl -L --fail --remote-name-all https://github.com/cilium/hubble/releases/download/$HUBBLE_VERSION/hubble-darwin-${HUBBLE_ARCH}.tar.gz{,.sha256sum}
shasum -a 256 -c hubble-darwin-${HUBBLE_ARCH}.tar.gz.sha256sum
sudo tar xzvfC hubble-darwin-${HUBBLE_ARCH}.tar.gz /usr/local/bin
rm hubble-darwin-${HUBBLE_ARCH}.tar.gz{,.sha256sum}
Step 4. Port forward Hubble in a separate tab
Use the following to port forward Hubble in a separate tab to prevent pods from crashing.
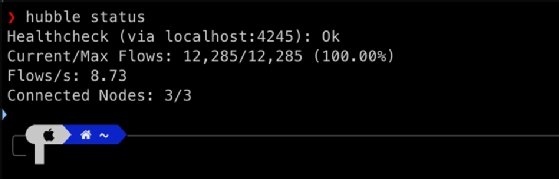
kubectl port-forward -n kube-system service/hubble-relay 4245:80
Run the hubble status command to check if Hubble is running correctly and you have access to the Hubble API.
Step 5. Enable and start Hubble UI
To enable Hubble UI, use the cilium hubble enable –ui command. To start it, use cilium hubble ui. Since there's nothing sending a request to Hubble UI, nothing is rendering. To simulate traffic and ensure Hubble UI functions properly, deploy a demo application.
Start in the same directory, and create a myapps.yaml file with the following code:
apiVersion: apps/v1
kind: Deployment
metadata:
  name: app1
spec:
  replicas: 1
  selector:
    matchLabels:
      app: app1
  template:
    metadata:
      labels:
        app: app1
    spec:
      containers:
        - name: app1
          image: nginx
---
apiVersion: apps/v1
kind: Deployment
metadata:
  name: app2
spec:
  replicas: 1
  selector:
    matchLabels:
      app: app2
  template:
    metadata:
      labels:
        app: app2
    spec:
      containers:
        - name: app2
          image: nginx
Step 6. Deploy the app
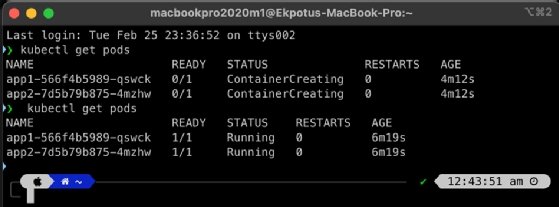
To deploy the app, use kubectl apply -f myapps.yaml. Next, make sure all the pods are running using the kubectl get pods command.
Step 7. Expose the deployments
Finally, it's important to expose these app deployments and make sure the port of the service isn't port 80, as Hubble UI listens on port 80:
- Run kubectl get svc.
- Get app1 using kubectl get pods -l app=app1.
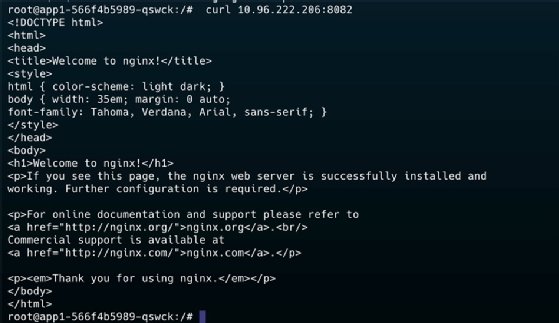
- Go into app1 pod: kubectl exec -it <app1-pod-name> -- /bin/bash.
- Generate some traffic by making a cURL request using curl google.com.
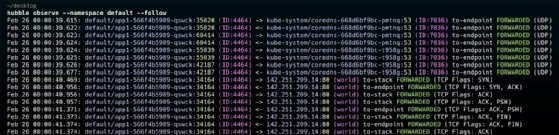
- To observe this traffic locally in the terminal, run the command hubble observe --namespace default --follow.
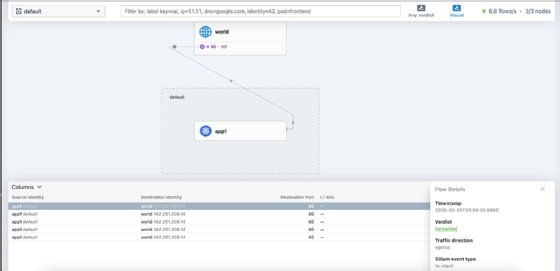
- Go to Hubble UI running in your browser, and observe the default namespace: http://localhost:12000/?namespace=default.
It's also possible to apply a default-deny Cilium network policy to block app1 from connecting to app2 while allowing kube-dns. In the same directory, create a default-deny.yaml file with the following code.
apiVersion: cilium.io/v2
kind: CiliumNetworkPolicy
metadata:
  name: default-deny-with-dns-allowance
  namespace: default
spec:
  description: "Default deny all traffic, allow kube-dns"
  endpointSelector: {}
  egress:
  - toEndpoints:
    - matchLabels:
        io.kubernetes.pod.namespace: kube-system
        k8s-app: kube-dns
  ingress:
  - fromEndpoints:
    - matchLabels:
        io.kubernetes.pod.namespace: kube-system
        k8s-app: kube-dns
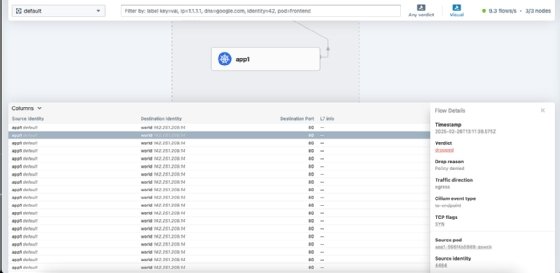
Next, apply the policy using kubectl apply -f default-deny.yaml, execute into app1 pod and try to call again using curl google.com. It's impossible to make that request and show verdict as dropped.
Use the following code to delete the default-deny Cilium network policy:
kubectl get cnp
kubectl delete cnp default-deny-with-dns-allowance
It's also possible to enable Hubble to show the type of request made by applying a policy for Layer 7 visibility by using the following code with L7-visibility.yaml.
apiVersion: 'cilium.io/v2'
kind: CiliumNetworkPolicy
metadata:
  name: 'l7-visibility'
spec:
  endpointSelector:
    matchLabels:
      'k8s:io.kubernetes.pod.namespace': default
  egress:
    - toPorts:
        - ports:
            - port: '53'
              protocol: ANY
          rules:
            dns:
              - matchPattern: '*'
    - toEndpoints:
        - matchLabels:
            'k8s:io.kubernetes.pod.namespace': default
      toPorts:
        - ports:
            - port: '80'
              protocol: TCP
            - port: '8080'
              protocol: TCP
          rules:
            http: [{}]
Then, create another policy to allow communication between both apps with allow-app1-app2.yaml.
apiVersion: cilium.io/v2
kind: CiliumNetworkPolicy
metadata:
  name: allow-app1-to-app2
spec:
  description: "Allow HTTP traffic from app1 to app2"
  endpointSelector:
    matchLabels:
      app: app2
  ingress:
  - fromEndpoints:
    - matchLabels:
        app: app1
  - toPorts:
    - ports:
      - port: "80"
        protocol: TCP
Now, apply the policies with the following code.
kubectl apply -f l7-visibility.yaml
kubectl apply -f allow-app1-app2.yaml
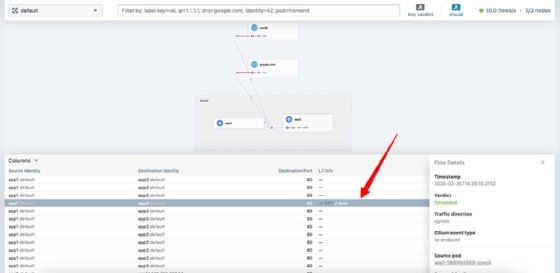
Make a request from app1 to app2 using its IP address using curl 10.96.222.206:8082.
Going over to Hubble UI, a GET request is indicated.
Understanding Hubble data
Hubble produces various data points, all of which network teams can use to pinpoint the source of network issues.
1. Flow logs
Flow logs provide a detailed account of all network interactions, such as the following:
- Source and destination IP addresses and ports.
- Protocols used, such as TCP, UDP and ICMP, among others.
- Kubernetes-specific metadata, including pod names, namespaces and labels.
- Connection timestamp and duration.
Use flow logs to identify unusual patterns, such as unexpected connections between pods, connections to external IP addresses or sudden increases in traffic volume.
2. HTTP header
For HTTP traffic, Hubble captures methods, paths and headers. This data is useful for investigating suspicious user agents, unexpected request patterns and attempts to access sensitive endpoints.
3. DNS queries
Hubble monitors DNS-related traffic, including query types and responses. This enables users to track high query volumes to uncommon domains and attempt to resolve known malicious domains.
4. Policy verdicts
Hubble logs whether traffic was permitted access to the network or denied based on network policies. Constant denial might indicate an attempted attack or a misconfigured policy. The Hubble service map helps visualize the denied traffic's source and destination for further investigation.
5. TLS information
Hubble provides details on Transport Layer Security (TLS) versions and cipher suites used in encrypted connections. This information helps identify insecure TLS versions and weak cipher suites that could lead to vulnerable connections.
6. Performance metrics
Hubble tracks latency, throughput and error rates. Sudden changes in these metrics could signify a DDoS attack, misconfiguration or compromised application.
Integrating Hubble with Prometheus and Grafana
To properly integrate Hubble with Prometheus and Grafana, it's important to upgrade Cilium with specific settings. Use the following code to do so.
helm upgrade cilium cilium/cilium --version 1.17.1 v
    --namespace kube-system \
    --set prometheus.enabled=true \
    --set operator.prometheus.enabled=true \
    --set hubble.enabled=true \
    --set hubble.metrics.enableOpenMetrics=true \
    --set hubble.metrics.enabled="{dns,drop,tcp,flow,port-distribution,icmp,httpV2:exemplars=true;labelsContext=source_ip\,source_namespace\,source_workload\,destination_ip\,destination_namespace\,destination_workload\,traffic_direction}" \
    --reuse-values
The --reuse-values flag keeps existing Helm values from a previous installation and only applies the new settings users specify.
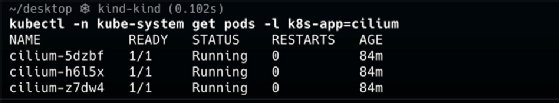
After running the upgrade, the code should read as the following.
kubectl -n kube-system get pods -l k8s-app=cilium
Expose Prometheus and Grafana locally
To expose the Grafana port, open another terminal, and use the following command.
kubectl -n cilium-monitoring port-forward service/grafana --address 0.0.0.0 --address :: 3000:3000
You should be able to access it in your browser using http://localhost:3030.
To avoid the ImagePullBackOff error when running this command, make sure to connect to Docker Hub. This way, the Kubernetes cluster can successfully pull the Grafana image.
To expose the Prometheus port, open another terminal, and use a similar, but slightly different command.
kubectl -n cilium-monitoring port-forward service/prometheus --address 0.0.0.0 --address :: 9090:9090
You should be able to access this in your browser using http://localhost:9090.
Configure Prometheus to scrape Hubble metrics
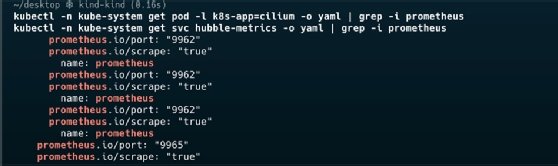
Cilium exposes metrics using annotations, which Prometheus can automatically discover in Kubernetes. However, it might be necessary to update the Prometheus configuration with the appropriate service discovery or static targets for Cilium pods and the operator. To check if service annotations are already enabled, make sure the code reads prometheus.enabled=true. Verify with the following code.
kubectl -n kube-system get pod -l k8s-app=cilium -o yaml | grep -i Prometheus
kubectl -n kube-system get svc hubble-metrics -o yaml | grep -i prometheus
Connect Grafana to Prometheus
To connect Grafana and Prometheus, first, add the Prometheus data source:
- Log into Grafana (http://localhost:3000).
- Using the gear icon on the left, navigate to Configuration > Data Sources.
- Click Add data source, and select Prometheus.
- Leave most settings default except the following:
- Name: Prometheus -- or any name you prefer.
- URL: http://localhost:9090 since Prometheus is port-forwarded.
- Click Save & Test. It should say Data source is working if Prometheus is reachable.
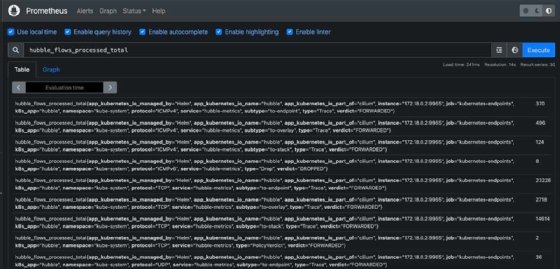
Next, verify metrics in Prometheus. Before building dashboards, confirm Prometheus has the metrics you want to visualize. Check available metrics in Prometheus by querying hubble_flows_processed_total. If it returns data, Hubble metrics are present.
Create or import a dashboard
Grafana can visualize metrics using custom dashboards or prebuilt ones. For Cilium/Hubble, importing a prebuilt dashboard is the fastest method. To import a prebuilt dashboard, follow these steps:
- In Grafana, click the plus icon on the left to go to Dashboards > Import.
- Use either the Cilium or Hubble dashboard IDs from Grafana Labs. Cilium Dashboard ID 13286 focuses on Cilium-agent metrics. Hubble Dashboard ID 13502 focuses on Hubble network metrics.
- Enter the ID, and click Load.
- Select your Prometheus data source from the drop-down menu.
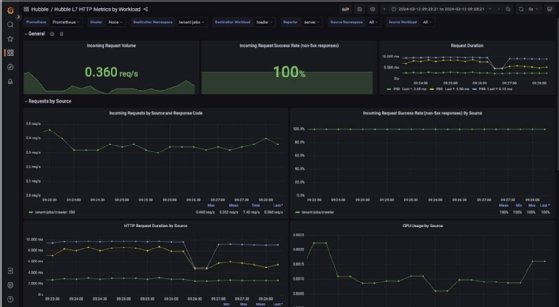
- Click Import.
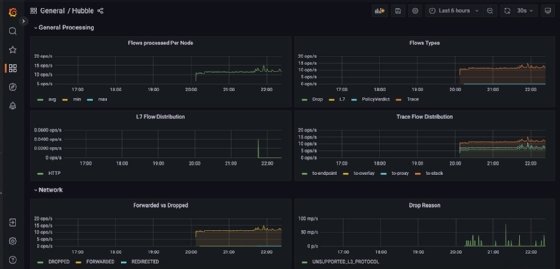
- Click on Hubble. You should arrive at a general processing dashboard.
When not to use Cilium Hubble
Hubble isn't a miracle program; it might not be the right fit for every situation. It's better to skip over or wait to use this program if any of the following apply:
- You're not on Kubernetes -- Hubble's focus is cloud-native workloads.
- Your team lacks eBPF or Kubernetes expertise. Teams must have Kubernetes knowledge to use Hubble, as the learning curve can be difficult for those unfamiliar with it.
- You need broad system-level observability that goes beyond networking. Look to tools such as Pixie or Grafana Tempo instead.
Wisdom Ekpotu is a DevOps engineer and technical writer focused on building infrastructure with cloud-native technologies.