Metrics upgrades, AR tool highlight Power BI platform update
The July update includes over 20 features, with highlights including new capabilities for Metrics, a tool that uses AR to add context to data and new embedded BI capabilities.
Enhancements to Metrics, a new tool titled Data in Space and enriched embedded analytics capabilities all highlight the latest Power BI platform update.
Microsoft unveiled the new features in a blog post in late July.
In addition to new capabilities within Metrics, new embedded analytics capabilities and the introduction of Data in Space, the update includes more than 20 new tools. Among them are features aimed at improving the reporting capabilities of Power BI, expanding its connectivity to other platforms and enhancing its mobile application.
Many of the new tools are incremental updates of existing capabilities. But given its breadth, the July Power BI update is significant for the platform's users, noted Doug Henschen, an analyst at Constellation Research.
"There are a lot of incremental tweaks and improvements in these monthly releases, but there were a couple of notable new capabilities and cases where a collection of incremental upgrades really add up to something powerful," he said.
Similarly, Donald Farmer, founder and principal of TreeHive Strategy, said the July Power BI update contains new features and enhancements that will benefit the platform's users.
"As always with Power BI these days, there are a lot of small but useful enhancements in this release," he said.
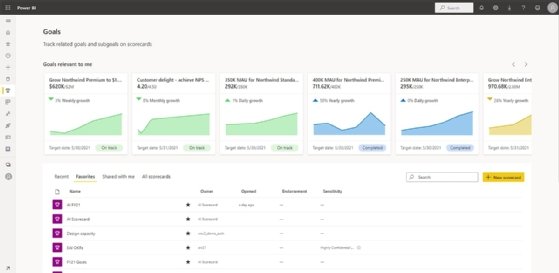
Metrics is a performance tracker that enables Power BI customers to specify key business objectives and milestones, assemble them in a single location, and use data curated in power BI to measure progress against those business objectives and milestones.
New Metrics capabilities in the latest Power BI platform update include the following:
improved data visualizations within Metrics;
the ability to move and copy performance scorecards so they can be developed and perfected before being shared to the workspace where they will ultimately be used to track performance;
a 'follow' feature so users can essentially subscribe to certain scorecards and access the scorecards they follow in one location; and
the ability to share a direct link within a given scorecard.
According to Henschen, the additions will not only better enable organizations to monitor performance but may also potentially lead to widespread adoption of the tool because they make Metrics simpler to use.
"The collection of updates around Metrics will help to drive insights to business actions," he said. "Metrics give organizations a way to monitor important business-driving key performance indicators. With this release, Microsoft … will improve usability and promote potentially viral adoption of Metrics."
A sample Metrics dashboard in Power BI displays the progress of an organization's initiatives that relate to a given employee.
According to Microsoft, the feature uses augmented reality technology within the Power BI app to create spatial anchors and then attach data in Power BI to those anchors to contextually integrate data with the physical world.
Use cases might include facility management, manufacturing and retail, enabling employees in given locations to make data-informed decisions specific to those given locations.
"I'm eager to see this as it hints at the metaverse meeting BI with possibilities for field service, asset management and so on," Henschen said. "I'm hoping it's as sexy as being able to point your phone at a physical asset in a manufacturing, shipping or retail location and seeing metrics and data visualizations pop up to tell you what's going on with performance."
There are a lot of incremental tweaks and improvements in these monthly releases, but there were a couple of notable new capabilities and cases where a collection of incremental upgrades really add up to something powerful.
Doug HenschenAnalyst, Constellation Research
Farmer, however, pointed out that while Data in Space may be new for Power BI, there are existing industry-specific applications that serve a similar purpose.
"Data in Space is not nearly as groundbreaking as Microsoft would like," he said. "Integration with augmented reality is already a reality for many manufacturing, industrial and energy sector applications. Having said that, now that it surfaces in Power BI, there will be many community-driven applications which may prove interesting."
And community-driven applications is where the new embedded analytics capabilities available in the Power BI platform update may be most beneficial as well, Farmer continued.
The enhancement improves the accessibility of embedded reports for users who may have visual or physical impairments by providing APIs that enable users to adjust zoom levels and add title attributes by writing minimal amounts of code.
This will not only benefit end users who may have visual or other physical impairments but also enable third-party developers who build websites and applications to meet federal accessibility requirements as well as those specific to certain industries.
"At last, it is easier to make embedded analytics more accessible," Farmer said. "This has been a barrier for [original equipment manufacturers] who have strict accessibility requirements in their market which they could not meet with Power BI. And it's just the right thing to do."
Additional features
Beyond the new Metrics capabilities and the addition of Data in Space, the most recent Power BI platform update includes a series of new and updated connectors so Power BI can communicate with outside sources.
Connect to Datamarts is now in preview, and a new connector to Eduframe is generally available. In addition, updated connectors to Databricks, Funnel and BitSight Security Ratings are available.
New reporting capabilities include Error Bars, which enable users to specify a range of potential values for uncertain data in line charts, and enhanced coloring capabilities for maps to show variations in data based on geographic locations.
And users can now use their mobile app to access Metrics to track milestones and targets.
"The list of [additions] is really quite useful," Farmer said. "Connectivity to Datamarts is essential of course, and error bars have been needed by serious analysts for a long time -- it's good to see them there at last."
Despite the additions of more than 20 new and enhanced capabilities, including some like error bars that Farmer noted Power BI had been missing, the platform still comes up short in one significant area, according to Henschen.
Power BI is considered one of the most full-featured suites of analytics tools along with peers like Tableau and Qlik, but unlike many of its competitors, Power BI continues to lack support for clouds other than Microsoft Azure, Henschen said.
While Qlik has made a point of being cloud agnostic, Tableau can deploy on AWS, Google and Azure -- among other clouds -- and other vendors like MicroStrategy, SAS and ThoughtSpot similarly enable users to deploy their platforms on the cloud of their choice, Power BI remains more tightly integrated with the Microsoft universe.
"The most obvious gap for Power BI compared to independents continues to be multi-cloud support," Henschen said. "Power BI can certainly tap into data sources on premises or on any cloud, but I have yet to hear anything about using Power BI services anywhere but on Azure."