To reap the full benefits of BI dashboards, they need to be designed to empower end users and improve the efficiency of BI software and the decision-making process.
A well-designed BI dashboard can benefit businesses in a few different ways.
BI dashboards are visual information tools organizations use to represent data and convey information efficiently. Dashboards have lots of appeal, but it is easy to miss the nuances separating well-designed dashboards and ineffective ones. Low-quality dashboard design and poor setup can limit its effectiveness. Businesses can achieve the following benefits with a well-designed BI dashboard.
1. Saving BI time
Even though BI dashboards are the responsibility of the BI team or department, they are not all the department does. Updating existing means of presenting data, such as dashboards and reports, and building new ones is one part of it. Another part of it is interpreting the data, spotting trends, raising red flags, etc. With a dashboard set to perform automatic updates, the BI team spends far less time producing and maintaining the dashboard. They can then utilize the time saved on other projects or spend more time analyzing data.
2. Empowering end users
There is another aspect of time-saving benefits connected to dashboards. In addition to improving the productivity of those building dashboards, BI dashboards can help increase the productivity of end users. A BI tool as simplified and clear as a dashboard empowers end users to manipulate data and get answers more efficiently. They can now obtain the answers they need independently and do not need to wait on the BI team to respond.
3. Improved efficiency enabled by BI software
Depending on which BI software a business uses, it can reap benefits from any extra features it may have. This is particularly useful when the features provide more efficiency.
If the software allows it, for example, a dashboard can be hosted on a cloud-based platform. This enables access to the dashboard regardless of location through a mobile app or a mobile responsive website. With this feature, dashboards are available to team members anytime and anywhere. In addition, depending on how intuitive the software is, employees can seamlessly drill down into the data to get quick answers to any questions they might have and which are not available at first glance.
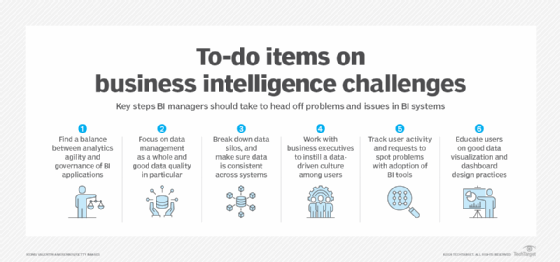
BI dashboard design is one of the top challenges BI managers face.
4. Bringing data together
Typically, BI dashboards benefit businesses by tracking processes from beginning to end. This holistic approach means dashboards often rely on data from different locations. Dashboards are a good place to bring together all available data sources. This way, organizations can establish relationships between the data they collect and analyze it all as one.
5. Focusing on KPIs
Dashboards are built to provide quick insights into some of the most important business processes. Dashboards work best if the information they contain is to the point and instantly visible. The dashboard-building process begins with determining its purpose and key performance indicators involved. KPIs are crucial metrics for the evaluation of a business process.
A BI solution as simplified and clear as a dashboard empowers end users to manipulate data and get answers more efficiently. They can now obtain the answers they need independently and do not need to wait on BI to respond.
In addition, well-designed dashboards do not have clutter and are concise. This means they allow quick access to KPIs set in the most appropriate context for the process organizations are tracking, enabling a deeper focus on those KPIs.
6. Improving the decision-making process
Simply put, the purpose of BI is to answer two main questions. First, "How well are we doing?" and secondly, "What do we do next?" These questions can be about the business as a whole or segments of it. "What do we do next?" is always followed by a decision. This is precisely the purpose of a dashboard. It is meant to provide answers to numerous questions with a single goal of making an informed decision.
7. Telling trends
With the requirements set and met, a dashboard gives insight into the well-being of a business. It is a form of quick business news for an organization.
Dashboards should lay out KPIs in a way that can provide a perspective of the past and current activities so organizations can predict what they will look like in the future and perhaps try to change their course. Being aware of the trends means organizations can make adjustments to procedures. From there, they can work toward either further improving their results or preventing issues from escalating and then improving the results.
BI dashboards can benefit businesses when they have the proper setup and design. For this reason, when building one, take the time and prepare it properly; understand its purpose and requirements in order to select correct KPIs, choose the right data to show and design it so it tells a story. Once it is built, tested and fully operating, a BI dashboard can be an extension of a BI team with 24/7 availability.