Microsoft Windows 7 Task Manager troubleshooting tips
Here are some troubleshooting tips for Microsoft Windows 7's improved Task Manager -- from identifying processes and services to using the Resource Monitor.
When looking for a troubleshooting tool for workstation computers, there is no shortage of freeware, including Microsoft's Sysinternals tools. By utilizing Mark Russinovich's technical expertise and creative ideas, powerful tools such as Process Monitor, Process Explorer and Registry Monitor can help diagnose difficult problems.
While these tools have great value -- I've used them many times to track down a problem -- they do require some skill to use and interpret the data. Wading thru process data is not for novices. In addition, I've spoken to some admins whose companies have strict policies about putting freeware on company computers -- even if it is for solving a problem.
One of the most improved tools in Windows 7 is Task Manager. This tool has been around since the Windows NT days, but it was only marginally useful before Vista because admins or users were unfamiliar with its features. Task Manager (Figure 1) has four tabs that both Windows XP and Vista have in common:
1. Applications -- This tab lists running applications and allows some manipulation, the most useful of which is to kill apps with the End Task button. You can also see the status of each app, such as "running" or "not responding." Note that just because an app is not responding doesn't mean it's hung -- it may just be busy doing something. Also, if an application is hung and needs to be killed, this is the best place to do it. Highlight the guilty app and click the End Task button.
2. Processes (Figure 1) -- Here is a list of all processes, the security context (username) it's running under and a variety of performance categories, such as CPU Usage and Memory Usage. Note that these can be sorted by clicking on the column header. If you click CPU Usage, it will order the processes from high to low usage or vice versa. Since this list is created in real time, it continually changes based on what is using high CPU. Sorting on the Image Name will permit you to view the CPU usage of processes without them bouncing around. There are easier ways to monitor this by using Resource Monitor (described later). Other Processes tab features include:
- You can add extra columns to show more detail, such as Page Faults, Paged Pool and handle count. Click on the View menu in the tool bar and choose "Select Columns." The default columns are CPU and Memory Usage. I recommend adding the "PID" column to show the process ID.
- Right-click to End Process, End Process Tree (be careful -- this is using a very big hammer!) and Set Priority. The Set Priority option (Figure 2) allows raising a process' priority, but it can have unintended effects on other processes. Don't use this unless you really understand what you are doing, and then just bump it to Above Normal, not High. Note that applications such as antivirus programs can set the priority to run as a high priority when running.
3. Performance -- In XP and Server 2003, this tab shows a real-time illustration of CPU and Page File Usage History. Figure 3 shows Windows XP's performance tab on the left and Windows 7's performance tab on the right.
4. Networking -- This tab shows network load, but I've never really found this useful.
Identifying Processes and Services
There are a couple of challenges with tracking down a problem app or process. One is figuring out which app a given process is tied to. For instance, in Figure 1, processes like Notepad.exe, and MagicDisk.exe are obvious. But what about McSACore.exe? A quick Internet search will usually show what app this is part of -- in this case, it's McAfee SiteAdvisor Service.
Another issue is the infamous "svchost.exe." Svchost.exe can contain multiple services. In Figure 4, there are a number of svchost.exe processes. If one of the svchost processes is taking up a large amount of CPU or RAM, you have to break it open to find the culprit. In XP, the command-line utility TaskList /svc was required to expose the services inside svchost by process ID. Each svchost has a unique PID.
| Image Name | PID | Services |
|---|---|---|
| System Idle Process | 0 | N/A |
| System | 4 | N/A |
| smss.exe | 328 | N/A |
| csrss.exe | 496 | N/A |
| lsass.exe | 628 | EFS, KeyIso, Netlogon, ProtectedStorage, SamSs |
| lsm.exe | 636 | N/A |
| winlogon.exe | 752 | N/A |
| svchost.exe | 912 | RpcEptMapper, RpcSs |
| svchost.exe | 1008 | AudioSrv, Dhcp, eventlog, lmhosts, wscsvc |
| svchost.exe | 492 | AeLookupSvc, BITS, Browser, CertPropSvc, EapHost, gpsvc, hkmsvc, IKEEXT, phlpsvc, LanmanServer, ProfSvc, RasMan, Schedule, SENS, ShellHWDetection, Themes, Winmgmt, wuauserv |
In Vista and Windows 7, Microsoft added a Services tab that lists the services by PID. Note in Figure 5 that the Services tab in the Windows 7 Task Manager shows the services broken out by PID. In this case, the list of services under svchost (PID 492) is exposed by sorting on the PID column in the Services tab just as they are using the TaskList/svc command-line tool.
Resource Monitor
Another addition to Windows 7 Task Manager is the Resource Monitor -- an option on the Performance tab. Think of Resource Monitor as a Performance Monitor plug-in to Task Manager. In fact, the PerfMon service runs with Resource Monitor. While it isn't full-blown PerfMon, it adds a lot of immediate performance data without having to set up PerfMon.
Figure 6 demonstrates the Vista version, showing the CPU, disk, network and memory performance individually and in an overview -- which is light-years ahead of what Windows XP had. Each of the categories can be expanded to show the top processes without having to jump back to the Task Manager Processes or Services tabs. Note that each category, such as CPU, has a real-time graph showing current utilization. The Learn More section includes a number of useful help topics.
While Vista has the Resource Monitor Utility, the Windows 7 version has some additional features, including filtering and a better memory map display. Figure 7 shows the CPU tab with Processes and Services expanded. Individual processes can be checked to focus the output. Without any processes checked, all services are exposed. These services can be started, stopped and restarted by right-clicking the service, just like in Services.exe, which is a nice consolidation of tools. Figure 8 shows the services running under svchost.exe, PID 492 -- on one screen now, instead of two or using the TaskList command. Truly one-stop shopping.
Disk
Figure 9 shows the Disk I/O and Disk Queue Length counters, two important counters in disk performance. Note that processes can be selected for isolation to check for disk activity with additional details in the Disk Activity section. This makes it easy to tie specific processes to high disk utilization without running PerfMon. Obviously, this is for viewing and not reporting, but it's a quick way to narrow down the scope of the problem.
Memory
The Memory tab is a great step forward to understanding memory usage. In Figure 10, the physical Memory is nicely displayed with a color bar graph. While this one is a little boring, we can easily see:
- 100 MB for hardware reserved
- 2,991 MB in use (by currently running apps)
- 4 MB modified (not "available")
- 1,001 MB available, which is standby (986) + free (15)
Microsoft's support teams have apparently struggled with customers who are concerned that they are running out of memory. Looking at the summary, it's easy to see that more than 1 GB is "Available" in this example. In the next article in this series, we'll dig deeper into some client performance issues, including how memory is actually mapped.
Task Manager in Windows 7 is a powerful, much improved tool for troubleshooting clients and servers. I would recommend getting familiar with Task Manager's features before trying to figure out reports from more sophisticated tools. Use those tools to drill down after Task Manager isolates the problem.
ABOUT THE AUTHOR: Gary Olsen is a solution architect in Hewlett-Packard's Technology Services organization and lives in Roswell, Ga. He has worked in the IT industry since 1981 and holds an M.S. in computer-aided manufacturing from Brigham Young University. Olsen has authored numerous technical articles for TechTarget, Redmond Magazineand TechNetmagazine, and he has presented numerous times at the HP Technology Forum. He is a Microsoft MVP for Directory Services and is the founder and president of the Atlanta Active Directory Users Group.

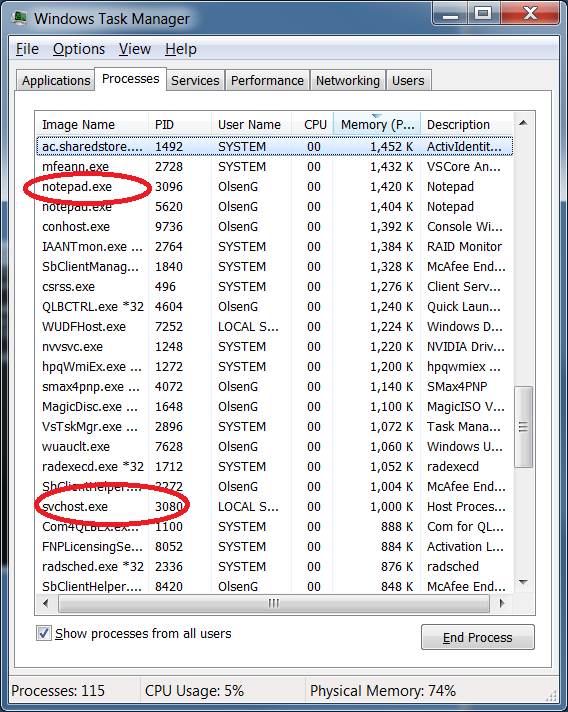 Figure 1
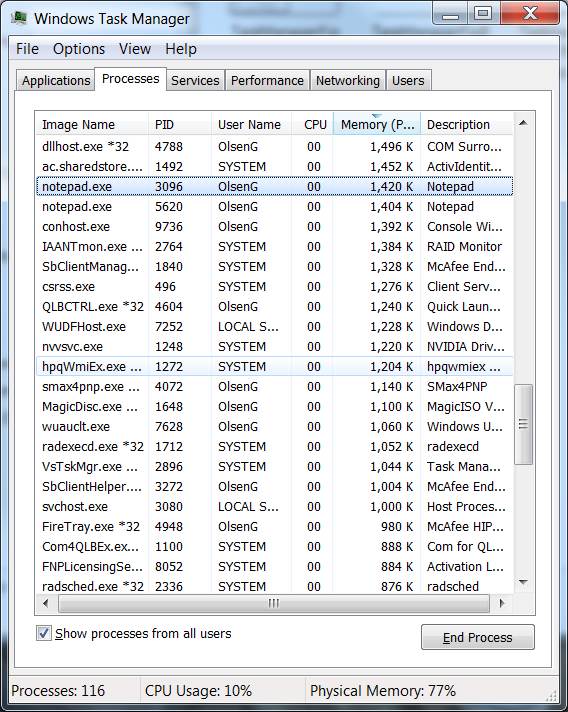 Figure 2
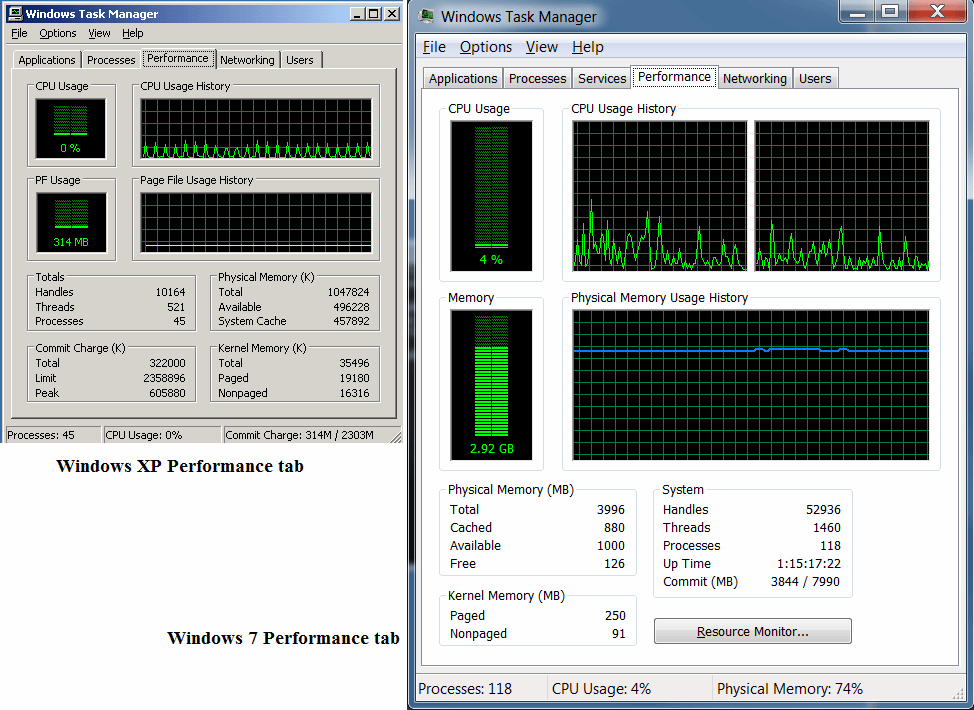 Figure 3
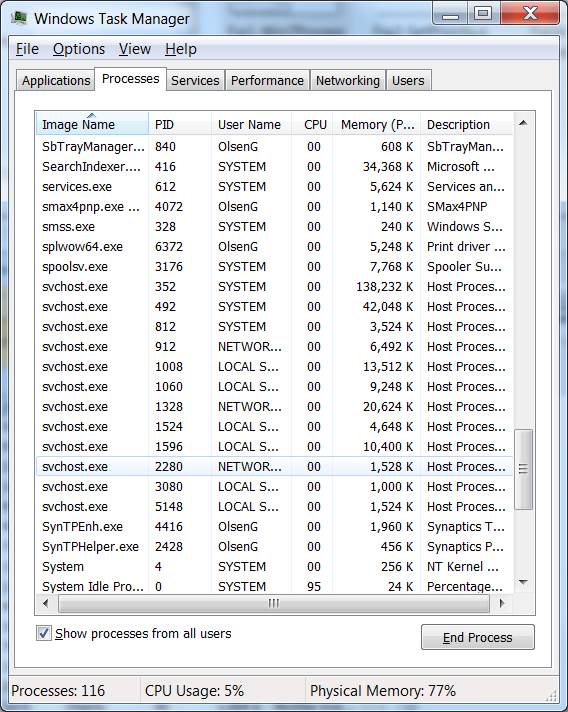 Figure 4
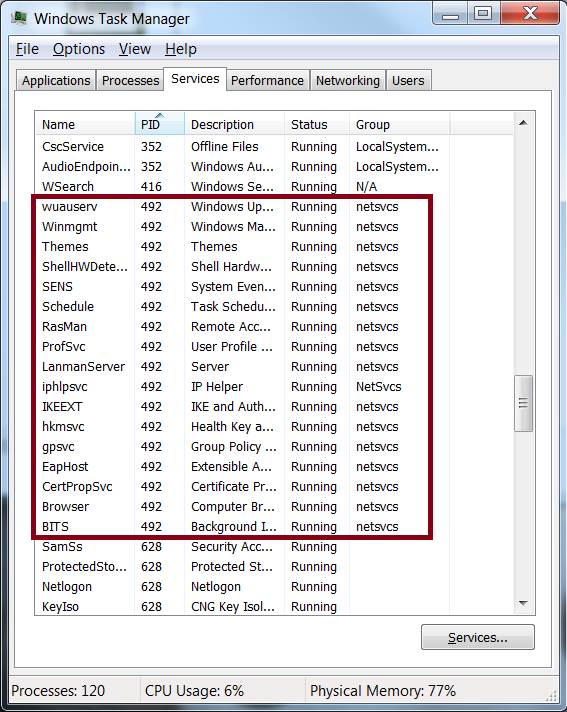 Figure 5
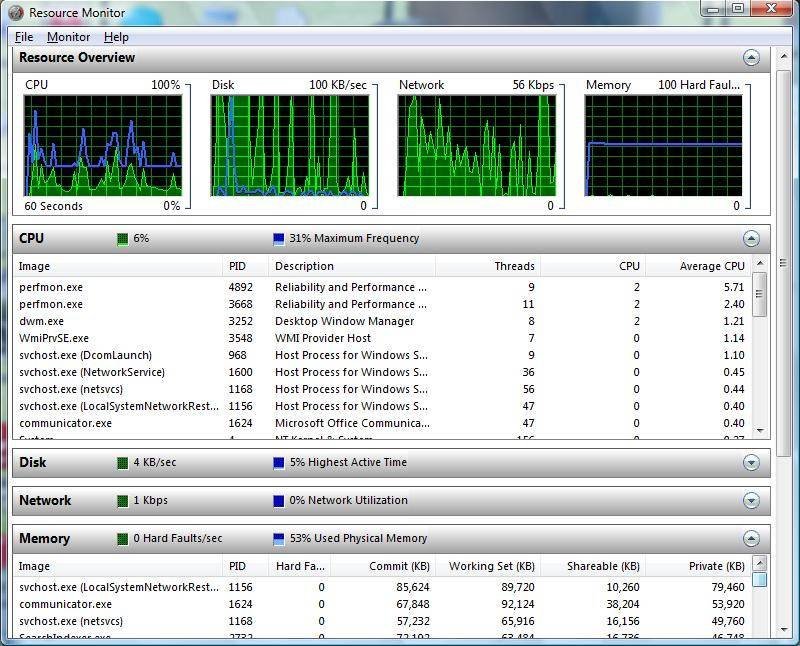 Figure 6
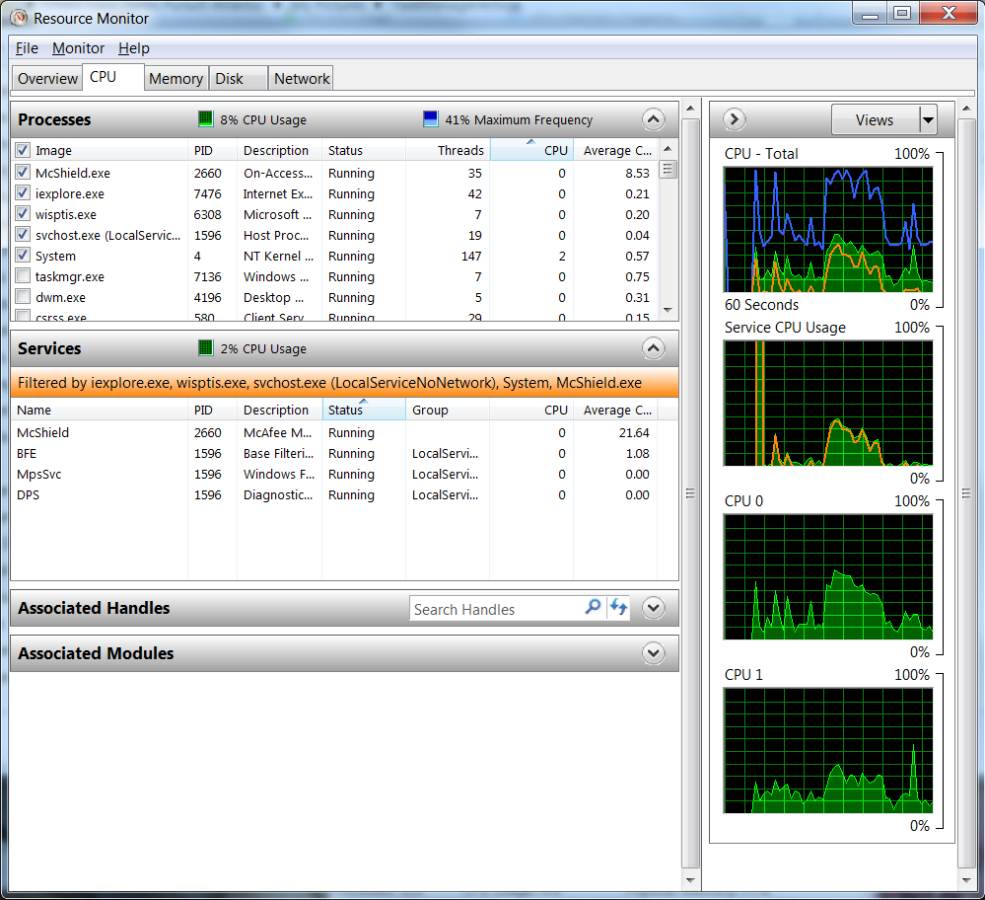 Figure 7
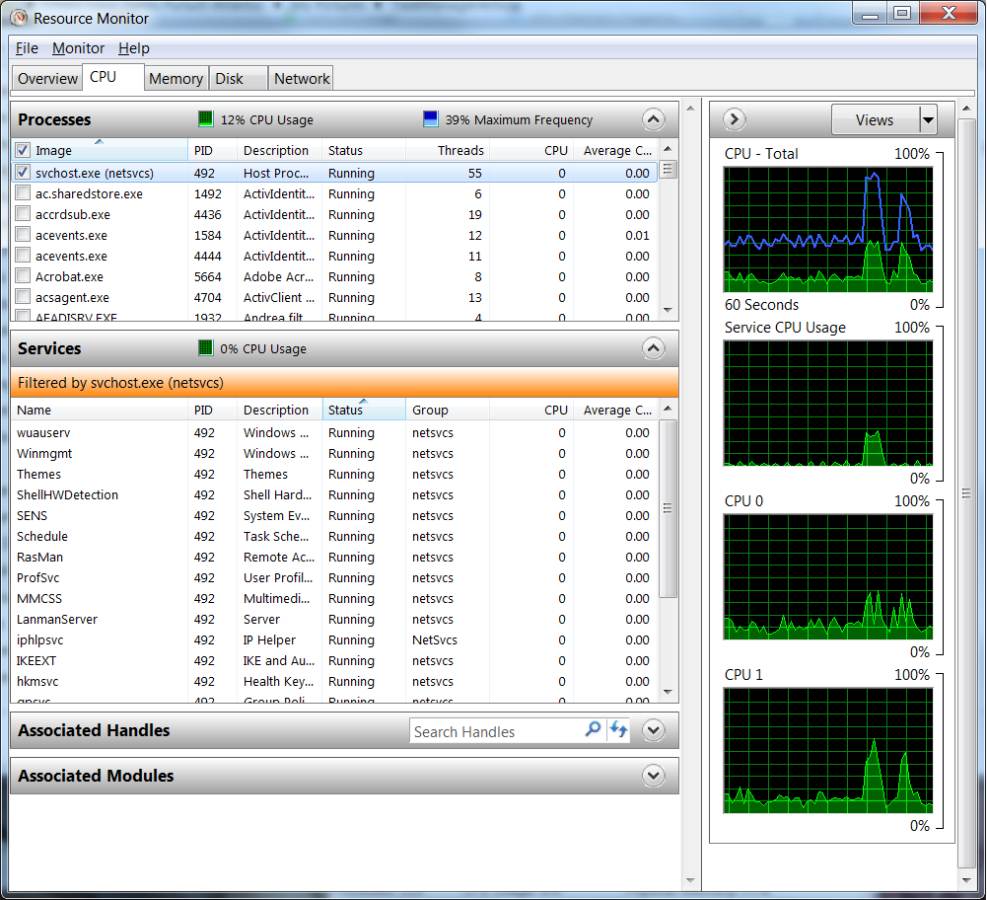 Figure 8
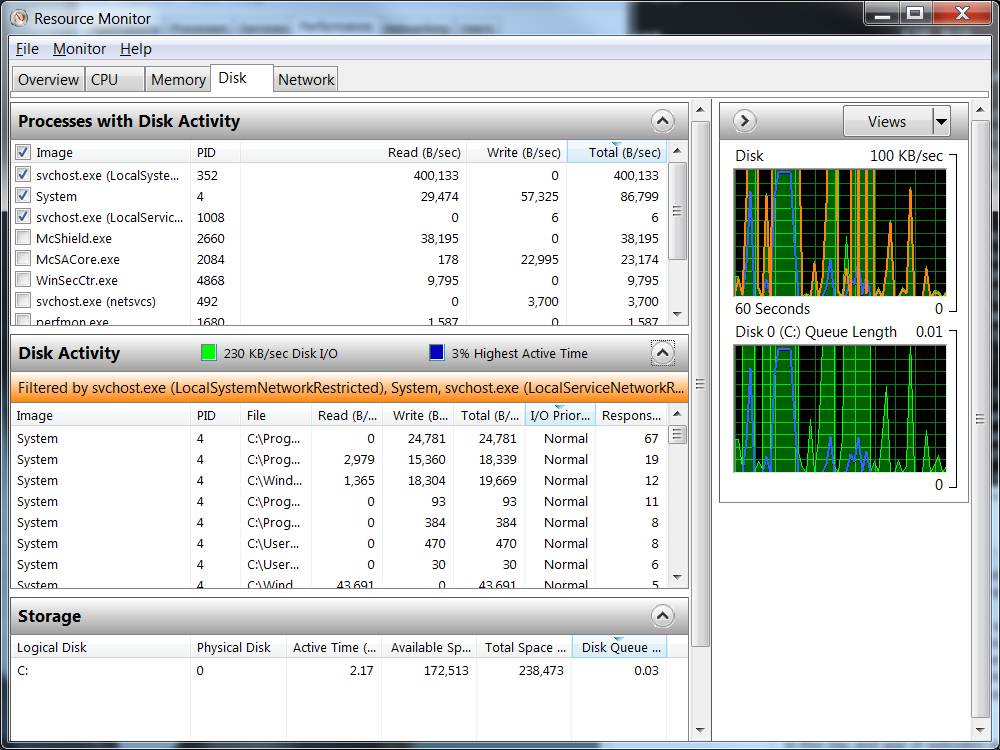 Figure 9
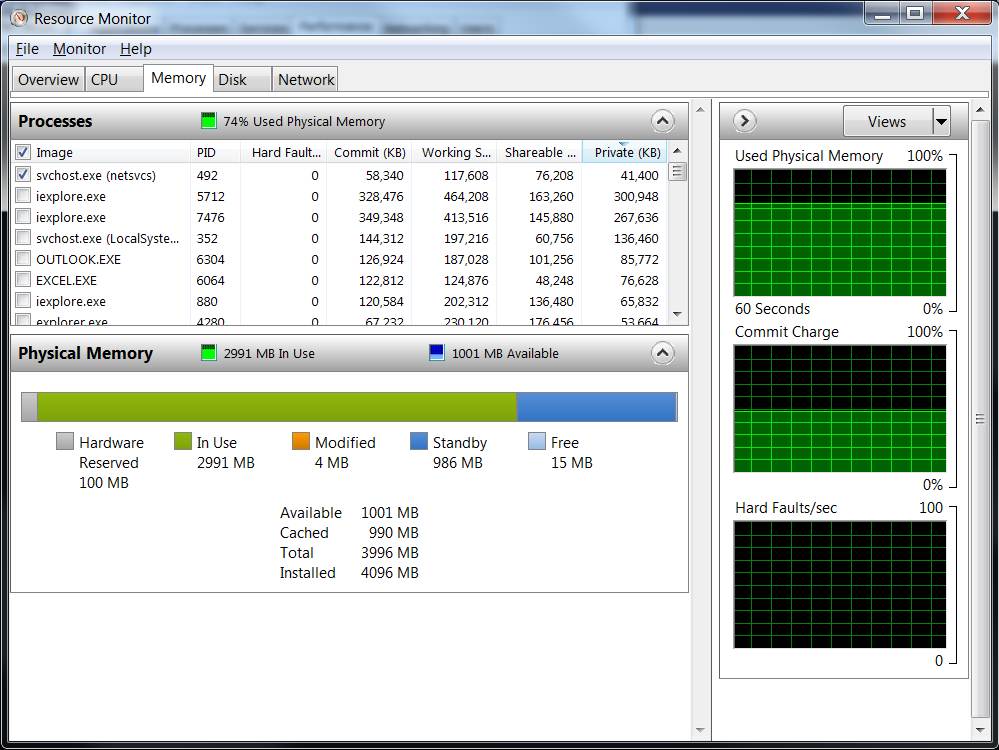 Figure 10


