Top 12 application performance monitoring tools
Discover the basic capabilities to evaluate when choosing an APM tool, and then review a list of APM vendors to help you get started with your selection process.

Business applications are incorporating a wider range of technologies and being distributed across a greater number of systems and geographic locations every day. In such a climate, it has become increasingly difficult to guarantee applications deliver the performance necessary to provide an optimal user experience. DevOps teams must come up with ways to ensure their applications operate at peak efficiency, and for this, they need an effective application performance monitoring tool that can see into every level of their applications, regardless of where they are and the technologies used.
What is APM?
Application performance monitoring (APM) refers to the process of actively monitoring an application's performance to ensure it operates at an optimal level and delivers a seamless user experience. Only through performance monitoring can DevOps teams effectively address performance issues and manage their applications.
An organization that deploys and manages applications requires an effective APM strategy to gather and quantify performance-related data from components that support the application delivery process. The teams responsible for those applications should be able to easily access information such as CPU utilization, memory demands, disk I/O speeds and application response times, as well as track error rates and the frequency an application runs into problems or fails.
Performance monitoring has grown increasingly important as applications become more distributed and complex, sometimes spanning multiple cloud environments or running in hybrid clouds. An APM strategy should not only monitor infrastructure and application components, but incorporate the ability to track business transactions, application dependencies and the overall user experience. Only then can DevOps teams see the entire application picture and get at the root causes of any issues that arise, so they can be addressed before they affect the user experience.
This article is part of
What is APM? Application performance monitoring guide
Tips for selecting an APM tool
To implement their APM strategies, organizations need monitoring systems that can track performance over time and provide DevOps teams with the information they need to proactively address performance issues. Choosing such a tool can be difficult, but there are some basic capabilities to look for in an APM tool. Ensure that it does the following:
- provides full-stack performance monitoring across all layers, down to the code and transaction levels;
- supports the programming languages and platforms used to develop and deliver the organization's applications;
- collects data efficiently, without affecting application performance, while supporting components at all layers of the application stack;
- includes user experience monitoring and diagnostics;
- monitors applications across on-premises, cloud-based and hybrid environments;
- facilitates effective traceability, diagnostics, root cause analysis and issue resolution;
- incorporates AI and advanced analytics to provide deeper insights into the collected data;
- integrates seamlessly with third-party tools and technologies;
- includes advanced alerting and notification capabilities that can be easily customized, with support for anomalous behavior detection;
- offers extensive reporting and visualization capabilities that make the collected data easy to understand and act upon;
- provides a platform that is simple to implement and use, while offering reliable technical support; and
- offers a cost-effective option that can help reduce overall application maintenance costs.
In addition to these capabilities, decision-makers must account for the more general characteristics of each platform. Consider the following questions:
- Is the platform offered as SaaS or as self-hosted software that can be implemented on premises or on a cloud-based platform?
- Does the platform rely solely on client agents to gather performance data, or does it support agentless data collection?
Finally, decision-makers should evaluate the product's scalability and the security mechanisms that are in place to protect the data.
Top application monitoring tools
Weeding through the wide assortment of APM tools is no small task, and it can be difficult to know where to begin. To help with the process, we've provided an overview of 12 of today's top APM tools.
1. AppDynamics APM
AppDynamics, part of Cisco, is a full-stack observability platform that incorporates extensive APM capabilities that can centralize and correlate performance analytics across the full application stack. Available as both an on-premises offering and as SaaS, AppDynamics provides end-to-end visibility into application performance and makes it possible to identify the root causes of problems in real time.
Key features:
- analyze applications at the code execution level;
- measure end-to-end business transaction performance;
- monitor the health of individual application and infrastructure nodes;
- automatically discover application topology and how application components work together;
- receive alerts based on custom or built-in health rules; and
- troubleshoot application errors and slow response times.
2. Datadog APM
Datadog is a SaaS-based observability platform that includes strong APM capabilities. It offers end-to-end distributed tracing that incorporates browsers, mobile apps, databases and individual lines of code. By correlating distributed traces with front-end and back-end data, Datadog APM can monitor health metrics and service dependencies, helping to reduce latency and eliminate errors.
Key features:
- gain visibility into the entire continuous integration environment;
- connect distributed traces to live processes, infrastructure metrics and network calls;
- monitor profile aggregations of services and endpoints;
- use machine learning analytics that automatically surface error and latency outliers;
- compare code profiles to identify performance regressions; and
- gain deep insights through out-of-the-box performance dashboards.
3. Dynatrace
Dynatrace is an observability platform available as cloud-based SaaS or as an on-premises service. The platform includes advanced APM capabilities that provide intelligent observability at scale for both enterprise applications and cloud-native workloads. Dynatrace also includes an AI causation engine that, along with automation, provides deep insights into the applications and underlying infrastructure.
Key features:
- monitor cloud environments, VMs, containers, server-side services and mobile apps;
- discover and monitor dynamic microservice workloads running in containers;
- monitor message queues to gain visibility into microservice communications;
- capture transactions across every tier, including the code level;
- gain insights into the DevOps pipeline for every build and deployment; and
- detect and monitor SQL and NoSQL databases.
4. Instana
Instana, an IBM company, offers Enterprise Observability Platform and an Application Performance Monitoring platform available as SaaS or self-hosted software. The platform includes fully automated APM capabilities to observe, monitor and fix applications and services. Instana uses stream processing to collect and analyze data in real time, providing immediate feedback with every application release, deployment and version.
Key features:
- discover and map all services and application dependencies;
- view anomalous events and entity relationship models in real time;
- logically define and view individual applications;
- access root cause analysis that correlates corresponding events;
- view cause-and-effect reports that link to more detailed information; and
- analyze trace and profiler data to identify bottlenecks and resource contention.
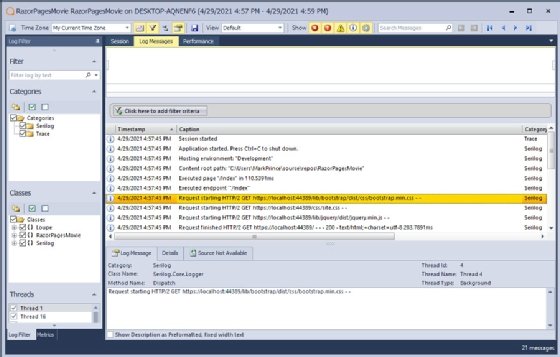
5. Gibraltar Software Loupe
Loupe is a log aggregation and analytics platform available as SaaS or a self-hosted offering. The platform enables organizations to gather data about .NET and Java applications from a variety of environments, ranging from smartphones to cloud-based platforms. In addition to log data, Loupe can gather system metrics and framework-specific events.
Key features:
- view details about actions, stack traces and metrics leading up to exceptions;
- capture data from third-party logging frameworks such as Serilog and NLog;
- track application users to identify their usage patterns and potential problems;
- analyze log data to identify, understand and resolve application errors;
- track details about the underlying hardware and operating systems; and
- set up alerts that automatically notify key players if errors occur.
6. ManageEngine Applications Manager
Applications Manager is an APM software product that offers visibility into application performance and the user experience, while providing additional insights through infrastructure monitoring. The platform isolates and resolves issues throughout the application stack, down to the code level. Applications Manager supports Java, .NET, PHP, Ruby and Node.js applications.
Key features:
- troubleshoot issues in development, testing and production environments;
- monitor front-end performance based on user traffic;
- track server, database, container, website and multi-cloud environments;
- view real-time dependency maps of entity relationships and dependencies;
- visualize data through more than 500 pre-built reports and interactive dashboards; and
- test the performance of critical user paths using synthetic transaction monitoring.
7. New Relic APM
New Relic is a SaaS-based observability platform that includes APM as one of its key services. Organizations can trace dependencies across their distributed applications to detect anomalies, address errors, optimize performance and improve the customer experience. The product offers visibility into the application stack, from back-end APIs to the user devices.
Key features:
- drill into errors and slow traces to find a problem's root cause;
- create alerts for specific metrics and channels;
- use unified pattern recognition and machine learning to understand data faster;
- track deployment markers that correlate deployments and performance;
- integrate with leading languages, frameworks and cloud-based providers; and
- troubleshoot incidents cascading through interconnected services using the automap feature.
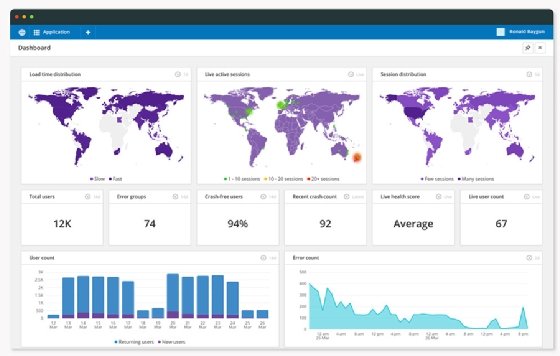
8. Raygun APM
Raygun APM is a SaaS server-side performance monitoring platform that provides both trend and real-time application and user experience data. The platform supports .NET, Ruby and Node.js software applications. It proactively identifies and alerts customers to performance issues. It also includes an automated issue creation engine that maintains a list of the most urgent performance concerns.
Key features:
- view performance data in charts and reports to identify issues in real time;
- configure custom rules for issue detection when performance thresholds are reached;
- access code-level diagnostics alongside their associated traces;
- analyze asynchronous threads through expandable trace views;
- apply code filtering to remove unwanted method captures and URLs; and
- monitor the effect of optimizations applied to an application.
9. Scout APM
Scout APM is a performance monitoring platform that provides proactive alerting and real-time insights into the application environment. Offered as SaaS, Scout APM provides error, database and external service monitoring, as well as basic application monitoring. Other features include deployment tracking, GitHub integration and background job monitoring.
Key features:
- view an application's performance and resource usage, in addition to related endpoint activity;
- access details about specific controller actions and background job workers;
- drill into transaction traces to view information about SQL queries;
- configure alerts on the application as a whole or on individual endpoints and background jobs;
- compare an application's performance between different time periods; and
- measure how long it takes for a request to reach an application from further upstream.
10. Site24x7 APM Insight
APM Insight is an AI-powered performance monitoring system for tracking application behavior and its effect on users in real time. APM Insight is offered as a SaaS-based product that can monitor the entire application stack, from the URL down to the database. It supports Java, .NET, PHP, Ruby, Python and Node.js platforms and can track and optimize all transactions.
Key features:
- monitor application performance across cloud, virtual and physical servers;
- view production information, application logs and performance issues from a single console;
- monitor individual transactions across microservices and distributed architectures;
- track business-critical transactions and performance;
- detect unusual behavior or performance spikes using the anomaly detection engine; and
- monitor custom components and metrics and analyze their performance.
11. SolarWinds AppOptics
AppOptics is a SaaS-based APM and infrastructure tool for hybrid and cloud-native IT environments. AppOptics enables organizations to visualize and troubleshoot application bottlenecks. The platform includes more than 150 out-of-the-box plugins and integrations for monitoring servers, virtual hosts and containers, with support for features such as distributed tracing, live code profiling and exception tracking.
Key features:
- view details about the health and performance of applications and supporting infrastructure;
- monitor infrastructure and application metrics side by side;
- create performance metrics that automate monitoring services and applications;
- receive proactive notifications when infrastructure resources violate defined thresholds;
- visualize the relationships among services and their dependencies; and
- view a summary of exceptions that occur within a service context.
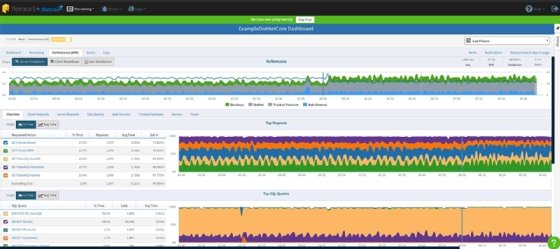
12. Stackify Retrace
Stackify Retrace is an application performance management and observability platform offered as SaaS. The platform aggregates performance, log, error and metric data to provide consolidated monitoring and insights into production and preproduction environments. Retrace includes enhanced search and drill-down capabilities into server and application logs, with the ability to create customized log queries.
Key features:
- compare log and exception data side by side for faster issue resolution;
- view details about HTTP calls, code-level traces, hidden exceptions and SQL queries;
- create customized dashboards with automated alerts, notifications and reports;
- merge client and server-side traces to create a comprehensive view of user interactions;
- track deployments and changes to key application code and configuration files; and
- identify poor-performing dependencies, legacy code and hidden exceptions.