With the launch of the second phase of its platform overhaul, the analytics vendor is enabling users to build their own visual experience without having to write code.
GoodData on Thursday unveiled the second phase of its analytics platform overhaul.
The vendor, founded in 2007 and based in San Francisco, launched the first phase in June after releasing a test version of the platform in April. The first phase consisted of the platform's business intelligence capabilities, while the second phase is the user experience.
Before overhauling its analytics platform, a process that began in 2019 and involved the examination and retooling of every capability, GoodData delivered a traditional suite of business intelligence tools with embedded BI as its core.
But BI as a standalone capability had become outdated and inefficient, according to GoodData founder and CEO Roman Stanek. It was disconnected from users' workflows, forcing them to go back and forth between their BI platform and the environment where they do their actual work.
So GoodData essentially started over, focusing on enabling customers to compose their own BI experiences by picking and choosing which capabilities they require and assembling them without having to write code.
Platform overhaul
In June, GoodData released what Stanek calls a "headless" BI platform made up of cloud-based microservices that enable users to work with data on demand anywhere they do their actual work.
Missing, however, was the user interface, and the second phase of GoodData's platform overhaul adds that aspect by enabling users to compose their own visual experience. With the launch of a new user interface, GoodData customers can quickly and easily design their own dashboards without having to wait for them to be built by IT or analytics teams, the vendor said.
Business users can choose from a set of modular blocks built by IT departments and put them together to create their analytics experience. In essence, it's comparable to building with toy Lego blocks, according to Stanek.
"This is the second part of the story," he said. "Our vision is to decouple analytics and divide it into two parts. Usually, analytics is a monolith. We look at it as what people call BI -- what does the magic -- [plus a] a visual experience, and analytics should not be focused around one use case or one type of user interface."
The bigger the organization, the more options are needed, Stanek continued.
"Having an API-first, headless engine was the first step, and now we are launching the whole suite of analytics interfaces," he said. "The main goal is to provide a wide range of interactions, from embedded to dashboard options."
Composable analytics, meanwhile, is a means of empowering business users that will contribute to more widespread use of data within organizations, according to Mike Leone, an analyst at Enterprise Strategy Group.
I believe the idea of enabling end users to piece together their own analytics experience is incredibly valuable as organizations continue focusing on best enabling stakeholders to be empowered to do more with data.
Mike LeoneAnalyst, Enterprise Strategy Group
"I'm impressed with their approach," he said. "I believe the idea of enabling end users to piece together their own analytics experience is incredibly valuable as organizations continue focusing on best enabling stakeholders to be empowered to do more with data."
In particular, the ability to build analytics experiences without needing to write code is something that will enable more people within organizations to use data in their everyday workflows, Leone continued. He added that ESG expects a surge in the adoption of low-code/no-code analytics tools.
"[GoodData's strategy] aligns perfectly to that growth area," he said. "By lowering the barrier to accessing data and analytics capabilities, organizations can set their teams up for success. They'll be enabled to improve accessibility, collaboration, and responsiveness to the business all fueled by trusted data."
Balancing act
According to Stanek, GoodData's platform overhaul is an attempt to bring balance to analytics.
Initially, BI was completely reliant on IT departments. Data was overseen by a small group within organizations, data consumers needed to submit tickets to request reports, and delivering those reports could take weeks or months.
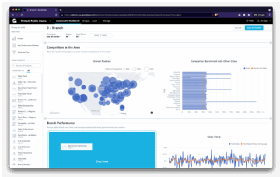
A sample dashboard from GoodData displays an organization's sales information.
Then came the era of self-service pioneered by Qlik and Tableau, among others. But that swung the pendulum too far in the direction of individuality, and a lack of uniformity within organizations ensued, Stanek said.
Anyone could build their own data models and interpret data however they saw fit, and without governance guidelines, that led to disorganized data and a subsequent lack of confidence in data-driven decision making.
Composable analytics aims to strike a balance, according to Stanek. IT teams can build the individual pieces, creating a single source of definitions and metrics, and then business users can compose their own experiences using the individual pieces that suit their needs.
"Now, we are trying to get it in the middle," Stanek said. "Users can trust the data -- they know it's reliable -- and yet it's not like a PDF file that they just need to take. It's an API that they can use and plug in and do calculations."
He added that GoodData's composable platform eliminates the need to have multiple BI platforms for different needs -- one for mapping, another for dashboards and still another for ad hoc analysis. In addition, he said a composable BI platform could not have been possible before the emergence of cloud-based analytics.
Phase 3
Now that the business intelligence capabilities and UI have been launched, the final phase of GoodData's platform overhaul will be to increase trust by integrating with data lineage and data governance tools.
And ultimately, the combination of the three phases is intended to enable more employees within organizations to work with data, according to Stanek.
"The main thing is increasing the penetration of analytics from 5% to 50% to 100%," he said. "It's all about trust, it's all about alignment, it's all about flexibility."
Enterprise Strategy Group is a division of TechTarget.