
What is business intelligence architecture (BI architecture)?
A business intelligence architecture is a framework for the various technologies an organization deploys to run business intelligence and analytics applications. It includes the IT systems and software tools that are used to collect, integrate, store and analyze BI data and then present information on business operations and trends to corporate executives and other business users.
The underlying BI architecture is a key element in the execution of a successful business intelligence program that uses data analysis and reporting to help an organization track business performance, optimize business processes, identify new revenue opportunities, improve strategic planning and make more informed business decisions.
Benefits of BI architecture
In the absence of a BI architecture, businesses and enterprises are at risk of making costly errors while striving to optimize their data utilization.
A well-articulated BI framework can offer organizations the following key benefits:
- Technology benchmarks. A BI architecture articulates the technology standards and data management and business analytics practices that support an organization's BI efforts, as well as the specific platforms and tools deployed.
- Improved decision-making. Enterprises benefit from an effective BI architecture by using the insights generated by business intelligence tools to make data-driven decisions that help increase revenue and profits.
- Technology blueprint. A BI framework serves as a technology blueprint for collecting, organizing and managing BI data and then making the data available for analysis, data visualization and reporting. A strong BI architecture automates reporting and incorporates policies to govern the use of the technology components.
- Enhanced coordination. Putting such a framework in place enables a BI team to work in a coordinated and disciplined way to build an enterprise BI program that meets the organization's data analytics needs. The BI architecture also helps BI and data managers create an efficient process for handling and managing the business data that's pulled into the environment.
- Time savings. By automating the process of collecting and analyzing data, BI helps organizations save time on manual and repetitive tasks, freeing up their teams to focus on more high-value projects.
- Scalability. An effective BI infrastructure is easily scalable, enabling businesses to change and expand as necessary.
- Improved customer service. Business intelligence enhances customer understanding and service delivery by helping track customer satisfaction and facilitate timely improvements. For example, an e-commerce store can use BI to track order delivery times and optimize shipping for better customer satisfaction.
To ensure their needs are met, C-level executives, business managers and other users who rely on data analysis to formulate strategies and guide their decision-making should have a stake in creating the architecture.
Business intelligence architecture components and diagram
A BI architecture can be deployed in an on-premises data center or in the cloud. In either case, it contains a set of core components that collectively support the different stages of the BI process from data collection, integration, data storage and analysis to data visualization, information delivery and the use of BI data in business decision-making.
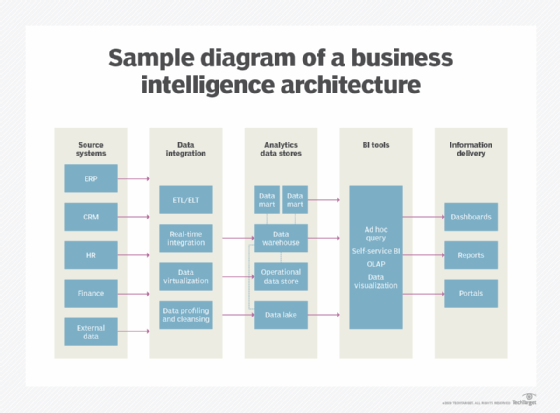
The core components of a BI architecture include the following:
Source systems. These are all of the systems that capture and hold the transactional and operational data identified as essential for the enterprise BI program. For example, this can include enterprise resource planning, customer relationship management, flat files, application programming interfaces, finance, manufacturing and supply chain management systems as well as secondary sources, such as market data and customer databases from outside information providers. As a result, both internal and external data sources are often incorporated into a BI architecture.
Important criteria in the data source selection process include data relevancy, data currency, data quality and the level of detail in the available data sets. In addition, a combination of structured, semi-structured and unstructured data types might be required to meet the data analysis and decision-making needs of executives and other end users.
Data integration and cleansing tools. To effectively analyze the collected data for a BI program, an organization must integrate and consolidate different data sets to create unified views of them. The most widely used data integration technology for BI applications is extract, transform and load (ETL) software, which pulls data from source systems in batch processes. A variant of ETL is extract, load and transform, a technology in which data is extracted and loaded as-is and transformed later for specific BI uses. Other methods include real-time data integration, such as change data capture and streaming integration to support real-time analytics applications, and data virtualization, which combines data from different source systems virtually.
A BI architecture typically also includes data profiling and data cleansing tools that are used to identify and fix data quality issues. They help BI and data management teams provide clean, consistent data that's suitable for BI uses.
Analytics data stores. This encompasses the various repositories where BI data is stored and managed. The primary repository is a data warehouse, which usually stores structured data in a relational, columnar or multidimensional database and makes it available for querying and analysis. An enterprise data warehouse can also be tied to smaller data marts set up for individual departments and business units with data that's specific to their BI needs.
In addition, BI architectures often include an operational data store (ODS) that's an interim repository for data before it goes into a data warehouse. An ODS can also be used to run analytical queries against recent transaction data. Depending on the size of a BI environment, a data warehouse, data mart and an ODS can be deployed on a single database server or separate business intelligence systems.
A data lake running on a Hadoop cluster or other big data platform can also be incorporated into a BI architecture as a repository for raw data of various types. The data can be analyzed in the data lake itself or filtered and loaded into a data warehouse for analysis. A well-planned architecture should specify which of the different data stores is best suited for particular BI uses.
BI and data visualization tools. The tools used to analyze data and present information to business users include a suite of technologies that can be built into a BI architecture -- for example, ad hoc query, data mining and online analytical processing software. In addition, the growing adoption of self-service BI tools enables business analysts and managers to run queries themselves instead of relying on the members of the BI team to do that for them.
BI software also includes data visualization tools that can be used to create graphical representations of data in the form of charts, graphs and other types of visualizations designed to illustrate trends, patterns and outlier elements in data sets.
Dashboards, portals and reports. These information delivery tools give users visibility into the results of BI and analytics applications with built-in data visualizations and, often, self-service capabilities to do additional data analysis. For example, BI dashboards and online portals can be designed to provide real-time data access with configurable views and give users the ability to drill down into data. Reports tend to present data in a more static format.
Other components that increasingly are part of a business architecture include data preparation software used to structure and organize data for analysis and a metadata repository, a business glossary and a data catalog, which can help users find relevant data and understand its lineage and meaning.
BI architecture tools
BI architecture tools facilitate the centralization of data collection as well as data analysis and visualization. These tools play an integral role in empowering businesses to make informed decisions and extract insights from extensive data sets.
Some examples of BI tools on the market include the following:
- Datapine. Datapine lets users access, view, analyze and share their company data on a single analytics platform. Users can perform data analysis, create interactive business dashboards and obtain new business insights through a simple drag-and-drop interface.
- Domo. The Domo cloud-based platform unifies data, systems and people for seamless business operations. It provides enterprise tools for data aggregation, analytics, dashboards and reporting for organizations looking to maximize data value.
- Dundas BI. This enterprise-level BI tool lets users create and customize interactive dashboards and reports. The software can either act as a central data hub or integrate into existing websites for customized BI capabilities.
- GoodData. As part of the GoodData platform, this tool offers an enterprise-level option for data analytics and business intelligence. It helps users analyze data coming from multiple sources and create reports.
- Infor Birst. Infor Birst is a cloud-based platform that uses a networked approach and modern enterprise-class architecture with a focus on multi-tenancy. Birst ensures that a company's data remains connected by centralizing both decentralized and centralized data.
- Microsoft Power BI. Users can run analytics either in the cloud or in a reporting server. The tool comes with built-in artificial intelligence features and offers end-to-end encryption features.
- Oracle Business Intelligence. This integrated set of tools lets users gather, store, analyze and report data for smart decision-making. In addition, it includes a scalable BI server, dashboards, a content library, web-based reporting and analytics tools.
- SAS Business Intelligence. This collection of tools lets corporate users conduct self-service analytics. Its two components -- Enterprise Business Intelligence and Business Visualization -- provide interactive visualizations and analytics to aid with data analysis and decision-making.
- Tableau. In addition to data visualization features, this tool offers live visual analytics and supports most databases and numerous data sources.
- Zoho Analytics. This self-service BI and data analytics software lets users analyze data, generate data visualizations and uncover insights quickly and easily. This tool is accessible to both small and large-sized organizations.
To extract the utmost value from BI technology, it's crucial to establish an adept business intelligence team. Explore the essential contributors who can drive the success of a business intelligence team.