TigerGraph Cloud update adds ML, data visualization tools
The latest from the graph database vendor includes a feature that enables users to build visuals without writing code and another that lets data scientists use familiar tools.
The latest TigerGraph Cloud update adds a new no-code tool for visualizing data and enhanced machine learning capabilities.
TigerGraph Cloud, first launched in 2019, is the vendor's graph database as a service. The vendor, which does not publicize pricing for its tools, also offers TigerGraph Enterprise for its on-premises customers.
Founded in 2012 and based in Redwood City, Calif., TigerGraph is a database vendor whose platform is built using graph technology. Unlike traditional relational database technology, which only lets data points connect to one other data point at a time, graph technology enables data points to connect with multiple other data points at the same time to create neural networks.
The result is that users can often more quickly and easily discover relationships between data points, thus speeding up the time it takes to query data and reach insights. Last year, Gartner predicted that 80% of data and analytics innovations will be made using graph technology rather than relational database technology by 2025.
In July, TigerGraph updated its SaaS version to add more security as more organizations adopt graph technology and migrate higher volumes of their data to the cloud. Previous updates included support for the Google Cloud Platform in April 2021 and Microsoft Azure in 2020, and the steady addition of connectors to platforms such as Snowflake and Tableau to enable customers to build an analytics ecosystem.
Now, TigerGraph has added Insights and ML Workbench in the update the vendor made generally available on Nov. 15.
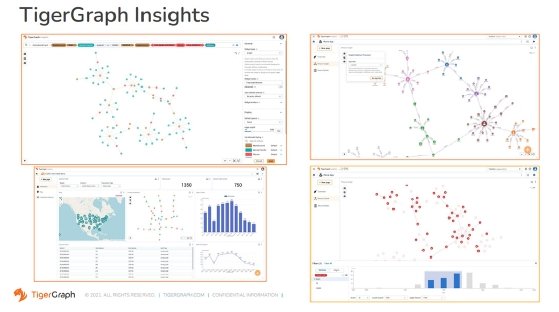
TigerGraph Insights visualizations display connections between data points.
New ML and graph learning capabilities
TigerGraph Insights is a low-code/no-code data visualization tool that lets customers create charts, graphs, tables and maps using data pulled from the vendor's graph database. In addition, the graphics built with Insights can be linked to one another within an interactive dashboard application so that users can share their insights and collaborate during decision-making.
TigerGraph already offers GraphStudio to enable customers to build visual representations of their data, but that tool requires technical expertise to navigate. Insights is navigated with point-and-click, drag-and-drop visual interfaces designed to make it accessible to both technical and nontechnical users.
And that enablement of nontechnical users -- which has the potential to drive greater adoption of graph technology -- makes Insights a significant addition to the TigerGraph platform, according Matt Aslett, analyst at Ventana Research.
There has been a concerted effort by graph database providers, including TigerGraph, to encourage the use of graph databases by users who are not graph database experts.
Matt AslettAnalyst, Ventana Research
"There has been a concerted effort by graph database providers, including TigerGraph, to encourage the use of graph databases by users who are not graph database experts," he said. "The potential use cases for graph databases are many, but understanding of graph data models and analysis techniques remains somewhat limited. Reaching a wider group of users is important to drive greater adoption."
Like Insights, ML Workbench also has the potential to drive greater adoption, according to Aslett.
Depending on the source, it's estimated that somewhere between 60% and 90% of data science projects never make it into production.
ML Workbench, while not designed specifically to reduce that percentage, is designed to address some of the problems that lead to a high failure rate.
First unveiled in preview in May 2022, ML Workbench is a graph machine learning tool designed to help data scientists improve the accuracy of ML models, shorten development cycles and help organizations derive more business value from data science projects.
The tool, which creates a single environment for building and training ML models, enables data scientists to tap into neural networks in TigerGraph to source their models. It provides more than 55 open source graph algorithms to assist them and uses Jupyter Notebook written in Python so that data scientists can develop and share their creations.
"TigerGraph recognized that in order to engage with data scientists, it needed to facilitate them applying their expertise to data in graph databases, while reflecting the tools and skills used by data scientists today," Aslett said.
In particular, Jupyter Notebook written in Python is familiar to most data scientists and is interoperable with the deep learning and cloud service platforms also familiar to data scientists, such as PyTorch, Deep Graph Library, TensorFlow, Amazon SageMaker, Microsoft Azure ML and Google Vertex AI, Aslett added.
Meanwhile, the vendor's impetus for developing Insights and ML Workbench came from customers, according to Jay Yu, vice president of product and innovation at TigerGraph.
"We have not done much until now to democratize graph visualization and analytics for nontechnical users," Yu said. "Our customers shared with us the desire to have a built-in self-service graph BI tool to mesh graph visualization with traditional BI analytics, and that's why we decided to focus on this area."
Similarly, ML Workbench was born from customer needs, according to Yu.
Data scientists could build ML models with data housed in TigerGraph's database, but TigerGraph's environment didn't include many of the tools they often use when building and training models. Instead, data scientists had to move the data back and forth between environments.
"We also identified a need from the data scientist community to tap into the TigerGraph graph analytics and graph machine learning capabilities on the cloud via tools of their choice: Python and Jupyter Notebook," Yu said.
Product roadmap
TigerGraph began developing Insights earlier this year, and it took the vendor about a year to ready ML Workbench for release, according to Yu.
Now, with both tools generally available as part of TigerGraph Cloud, the vendor plans to add more functionality to them in subsequent releases, he said.
Future Insights updates will include improved visual rendering capabilities and more visual options. Targeted improvements for ML Workbench include simplifying the APIs and graph algorithms used to build and train models, and adding more algorithms to the more than 50 already included in the tool.
"Most of these will be driven by customer feedback," Yu said.
Aslett, meanwhile, said he'd like TigerGraph to continue keeping data scientists in mind as it plots its roadmap, and that while the vendor has a cloud offering, it could use improvement.
He noted that the vendor's core technology -- its graph database and graph analytics tools -- is strong compared with peers such as Neo4j and with tech giants such as AWS and Oracle that offer graph-based tools, but there remains room for growth in other areas as TigerGraph builds out its suite of tools.
"TigerGraph's focus on data scientists is a work in progress, as is its embrace of cloud architecture and managed services," Aslett said. "Both stand to gain from further research and development as well as increased sales and marketing."